Understanding Japanese Candlestick Patterns
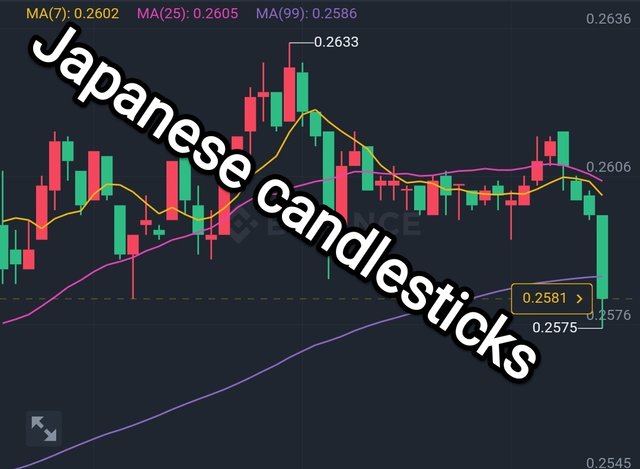
To the traders, it's always red and green. Red is danger, green is milking. These two colours are highly known when trading and the charts pictures these two colourful sticks going up and down, long and short. Could there be more to these candlesticks? Let's understand what Japanese candlesticks is.
Japanese Candlestick Charting |
|---|
This is actually more than just a tool that contains data for various timeframes on individual price bus and build patterns that predict the direction of price once completed. Candlestick pattern and one of the most widely employed components of technical analysis used by Traders to aid their view of market price movement. The candlestick emerged in Japan for rice trading during the 18th century and it has become so popular that they provide investors with information quickly from those price bars.
The expression Candlestick mean two different but related terms. The first theme is one that displays information about security to analyse chat while the second is the act of identifying certain known and previously tested combinations of Candlestick. These two techniques can be used separately or simultaneously.
The information used to reflect the whole market situation by means of a candlestick chart showing high, Lowe's and even opening and closing price is the one that is usually used for bar charts. They use almost the same information that facilitate interpretation and analysis of Traders.
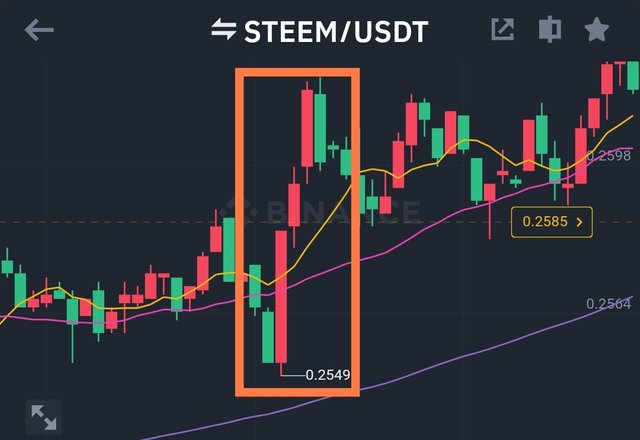
A candlestick as shown in this diagram is rectangular and is called a body which represents the difference between the opening and closing price for the Same day. The body of this candlesticks can be white or black but mostly green and red to show exclusiveness. The green body shows I mean the closing price was higher than that of the opening while the red stick means the closing price was lower than that of the opening price.
Both opening and closing prices are integral in Japanese candlesticks and are mostly used by Traders to identify signals and trades. A candlestick pattern may consist of a single line or combination of multiple lines used to identify market turns or reversal points. Some other patents are used to determining train continuity which makes it a continuation pattern and the latter, reversal pattern.
When candlestick pattern descend, they usually form an uptrend which is a signal of point of resistance. When candlesticks ascend, they really follow a downtrend which indicates a reversal in the direction in which prices are moving in the market.
There are dozens of candlesticks identified by colourful names that reflect Japanese culture. Among the most common candlestick patterns, the following are included.
- Two Black Gapping: this is when two Bearish black gap in continuation pattern appears after a notable high in an uptrend with the gap downtrend which produces two red bars that record lower lows. This type of pattern predicts that the decline will continue to even lower which could trigger a larger-scale downtrend. According to Bulkowski, this pattern predicts lower prices which have an accuracy of 68%.
- Three Black Crows: this particular pattern begins at or near the high of an uptrend with three large read candlesticks with shorts or virtually non-existent wicks. Each session opens with a price similar to the previous day's price, but selling pressure causes the price to fall further and further at each close, potentially triggering a large-scale downtrend.
Investors can actually interpret this candlestick patterns as the beginning of a downtrend as the number of sellers outnumbered the number of buyers for 3 days in a row. According to Bulkowski, the patent predict lower prices with an accuracy rate of 78% compared to the two black gapping.
- Three Line Strike: this is one of the most powerful reversal patterns composed of five bars. The three bar in the direction of a trend, followed by a final candlestick retracing back to the starting point. Investors actually use this pattern as an opportunity to buy at a current trend low or sell at a current high.
The bearish information is composed of a large red candlestick, three descending candlesticks and an ascending green candlestick that erases the decline made by the three previous candlesticks. According to Bulkowski, the reversal predicts higher prices with 83% accuracy.
In conclusion, this trading tool is what most traders use in understanding price movements in the market before making a leap. Most people consider using it more than the trading strategy indicators like moving averages and the likes of them. Could there be more? What out for my next post.
Disclaimer :Any financial and crypto market information provided in this post was written for informational purposes only and does not constitute 100% investment advice. It's just basic knowledge every crypto trader or investor should have
https://twitter.com/bossj23Mod/status/1728178209961689348?t=t46GpMBUgoyWmkjouxHklg&s=19
Hello @bossj23,
You should have given us befitting images for this types of Japanese candlestick you shared