The Great Scholar Who Invented Chess and Ethereum Price Analysis

In the traditional investment approach, we express the return on investment in percentages. It's like, "I'm getting ten percent interest a year." In the newly developing investment approach, returns are expressed in multiples. For example: "Brother, I found a new altcoin; I expect 10x in two years". The young generation immediately adapted to this new understanding. My generation is still a bit cautious about it.
No matter what age we are, our minds are not very good at grasping geometric increments. Because in our daily life, we see that things increase arithmetically. Perhaps a story can help understand the issue better. The original of the story is quite long; I'll shorten it.
The Great Scholar Who Invented Chess and The King
It is rumored that the great wise who invented chess 1400 years ago gave it to the Indian king. Although the king did not like the gift he received initially, he liked this game very much over time. And as always in fairy tales, he said to the great scholar, "Ask whatever you wish from me."
"My king, I do not ask for too much from you," said the wise who was blind to money. You just need to give wheat. Look, this chessboard is 64 squares. 1 wheat for the first square, 2 for the second, 4 for the third, 8 for the fourth, and then enough wheat to fill each square, always double like that, ”he said.
The king was angry. “Great Scholar, I could give you gold, diamonds, land, mansions. Do you want only wheat, bewilderment,” he said.
However, when the total wheat was calculated, it was found that 570 billion tons of wheat were required. This amount of wheat could only be produced in about 1000 years ...
Logarithmic Graphs
In the cryptocurrency world, prices are increasing exponentially, similar to the story. Logarithmic-scale tables best show the value development of assets that increase exponentially over time. The table showing the increase in Bitcoin prices since 2013 logarithmically is given below.
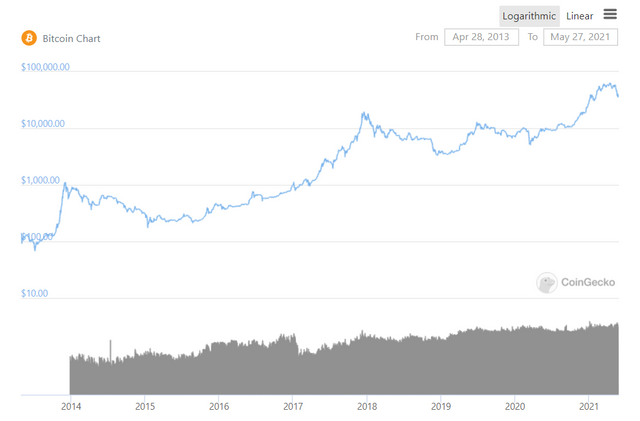
Looking through the logarithmic table, it becomes more evident that the prices have increased exponentially. Let's take a look at Ethereum prices on a logarithmic chart.
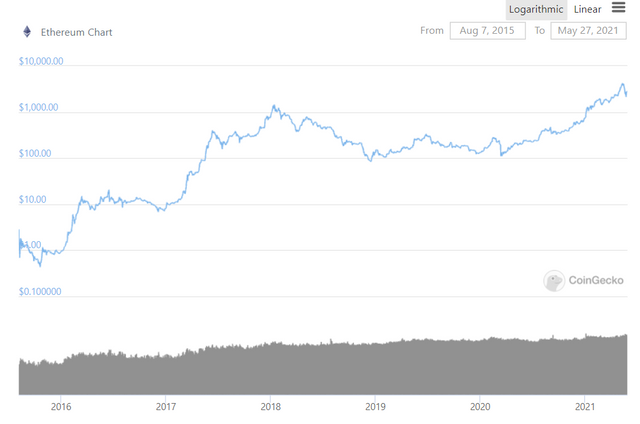
Although it is more volatile compared to Bitcoin, we can easily see the exponential development. (Note the numbers 1,10, 100, 1000, 10.000 on the left)
Ethereum Price Analysis
Without further ado, I want to move on to Ethereum price analysis. This time I used a normal scale chart.
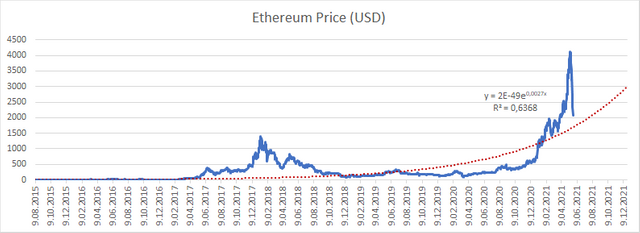
The blue line shows the change of Ethereum prices in dollar terms since 2015, and the red line shows the exponential trend derived from this data. I drew the chart in Excel. When we advance the trend line until the end of 2021, we find the year-end price forecast as $ 3000. Considering that the current price is $ 2573, you may not find the year-end forecast of $ 3000 exciting. However, if we accept that the trend drawn is correct, we will accept that the Ethereum price will exceed $ 5000 by the end of 2022. Such an expectation will result in early pricing.
It is still useful to be cautious while evaluating the results of my analysis. Due to psychological factors, prices may remain below or above the prediction for a long time as Ethereum prices stagnate from the beginning of 2018 to September 2020. Using this information together with classical technical analysis methods will be appropriate to determine the investment timing.

As a result, I am growing my Ethereum portfolio. In fact, a similar potential applies to any crypto that has reached a certain size. You should still do your own research and decide because I'm not an investment expert.
Thanks for reading.
Image Sources:
https://pixabay.com/photos/chess-king-chess-pieces-pawns-2727443/ and https://giphy.com/gifs/animated-gif-expand-exponentially-ftAyb0CG1FNAIZt4SO