These Amazing Moves Can Make Stratis (STRAT) Coin Of The Month
Hi, friends hope you are well, here I have found another profit potential trading idea for you, and this time I have found a harmonic move by Stratis. The Priceline of STRAT is forming bullish Shark patterns with Bitcoin pair and also in the US Dollar market as well and soon it will be entered in potential reversal zone for next bullish rally soon.
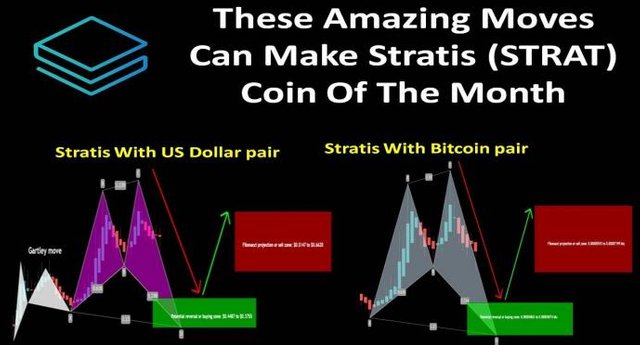
Stratis (STRAT) with US Dollar pair Shark formation:
After initial leg (X to A) the A to B leg is retraced between 0.382 to 0.618 Fibonacci and then B to C leg is projected between 1.13 to 1.618 of A to B Fibonacci projection area and last leg (C to D) can be retraced between 0.886 to 1.13 Fibonacci for the completion of the final leg of bullish Shark. Then we can expect bullish divergence that will lead the priceline between 0.382 to 0.786 Fibonacci projection of C to D leg, but if after this bullish divergence the candles sticks will be closed above the 0.786 Fibonacci projection area of C to D leg then it can also lead to the long term bullish move.
Buying And Sell Targets:
The buying and sell targets according to harmonic Shark pattern should be:
Potential reversal or buying zone: $0.4487 to $0.3755
Fibonacci projection or sell zone: $0.5147 to $0.6620
Stop Loss:
The potential reversal zone area which is up to $0.3755 can be used as stop loss in case of complete candlestick closes below this level.
Possible profit and loss ratio:
According to the above targets, the profit ratio can be up to 76% and in case of stop-loss, the loss ration can be 19.5%.
Stratis (STRAT) with Bitcoin pair Shark formation:
After initial leg (X to A) the A to B leg is retraced between 0.382 to 0.618 Fibonacci and then B to C leg is projected between 1.13 to 1.618 of A to B Fibonacci projection area and last leg (C to D) can be retraced between 0.886 to 1.13 Fibonacci for the completion of the final leg of bullish Shark. Then we can expect bullish divergence that will lead the priceline between 0.382 to 0.786 Fibonacci projection of C to D leg, but if after this bullish divergence the candles sticks will be closed above the 0.786 Fibonacci projection area of C to D leg then it can also lead to the long term bullish move.
Click here to create free account on tradingview to watch and play the chart on realtime
Buying And Sell Targets:
The buying and sell targets according to harmonic Shark pattern should be:
Potential reversal or buying zone: 0.00004863 to 0.00004074 btc
Fibonacci projection or sell zone: 0.00005593 to 0.00007199 btc
Stop Loss:
The potential reversal zone area which is up to 0.00004074 btc can be used as stop loss in case of complete candlestick closes below this level.
Possible profit and loss ratio:
According to the above targets, the profit ratio can be up to 76% and in case of stop-loss, the loss ration can be 19.5%.
Note: This idea is education purpose only and not intended to be investment advice, please seek a duly licensed professional and do you own research before any investment.