Another Powerful Move By DigiByte (DGB) | Going To Form Next Bull Flag
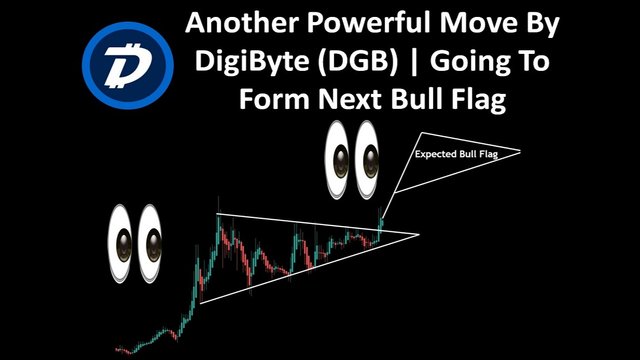
Hi, friends hope you are well in welcome to the new update on Digibyte coin. In my previous post, we have seen that the price line of DGB was moving in a pennant on the daily chart. Today we can see that the candlestick is breaking out the resistance of this pennant. Now we should wait for the candlestick to close above the resistance once we will have today's closing above the resistance then we will be confirmed that the resistance of this pennant has been broken out.
The Bill William 3 lines have given buying signals:
If we place the bill Williams 3 lines that are also called bill William alligator indicator on this daily chart. Then we have the smallest time period moving average that is moving average 5 above all then we have the moving average 8 and then 13 moving average is below all other moving averages that are considered as a buying signal.
The priceline is bounced from SMA:
Previously we have seen that the priceline was at the support of 25 simple moving average and even it was re-testing the 50 simple moving average support as well. Now the price line is bounced from these simple moving averages moreover, Now the smallest time period moving average is above all then we have the 50 simple moving average then 100 and then 200 simple moving average is below all other SMAs. And this order of the moving average is called in open alligator mouth by that simple moving averages that can produce a more powerful bullish move.
Strong resistance of SMA:
Now if you wish to the weekly chart then it can be observed that the price line is not able to cross up the 200 simple moving average. And this SMA has become a very strong resistance to the price action of DGB. However, the priceline of Digibyte also has the supports of 25, 50, and 100 simple moving averages as well. The 25 and 50 moving averages are moving upside to cross 100 SMA. And once this bull cross will be formed between these SMAs then we can expect the priceline will be able to break out from this resistance of 200 simple moving average as well.
Click here to create free account on tradingview to watch and play the chart on realtime
Conclusion:
Even though the price line of Digibyte is at the strong resistance of 200 simple moving average on the weekly chart. But as on the smaller time period chart, the price action of the DGB is breaking out the pennant. Therefore we can expect that it will be a bull flag and the priceline will move more up to form the next bull flag. Therefore the priceline can also break out the 200 simple moving average resistance on the long-term weekly chart as well.
Note: This idea is education purpose only and not intended to be investment advice, please seek a duly licensed professional and do you own research before any investment.