After More Than 9000% Big Move Band Protocol Formed Bull Flag For Next Rally | Coinbase Pro Listing
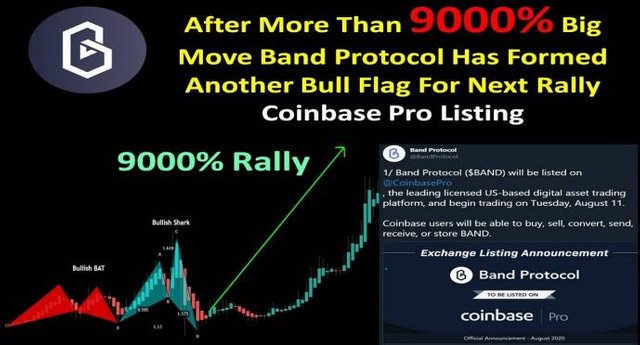
Hey, friends hope you are well and welcome to the new update on Band protocol. This token has surged more than 9000%. In today's article, we will try to understand how this token completed the bullish setup and what kind of signals we had before this surge and what the price action can do next.
Continuity of bullish harmonic moves can be a strong bullish signal:
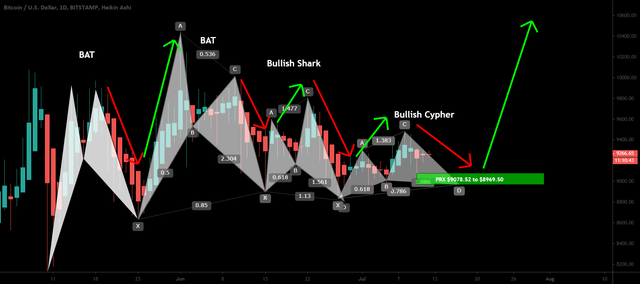
Before starting the bullish move the price action of Band protocol formed different harmonic patterns on the daily chart. First it formed bullish BAT pattern then the price action of Band token formed another harmonic Shark pattern. And finally took a powerful bullish divergence and produced more than 9000% rally.
This is the same as like Bitcoin did. The price action BTC formed different harmonic patterns on the daily chart from the month of May 2020. And I have been sharing all these patterns in every article of Bitcoin. And finally, in July 2020 the Bitcoin formed a bullish Cypher pattern. After entering in the potential reversal zone the BTC started the upside move and spiked beyond 12K. Whenever the price action of any asset starts forming different bullish harmonic patterns. At least on the daily chart. It can be is a very significant signal that the priceline is going to explode soon.
Click here to visit this old article on tradingview
A continuity of different events:
If you have missed the previous rally then no worries. Because the price action has started another bullish rally. As we can see the different events with continuity announced by Band protocol team and the different exchanges as well. These events led the price action to surge 350% more sofar.
Crypto.com Lists Band Protocol (BAND):
https://blog.crypto.com/crypto-com-lists-band-protocol-band/
Hobit exchange Lists Band Protocol (BAND):
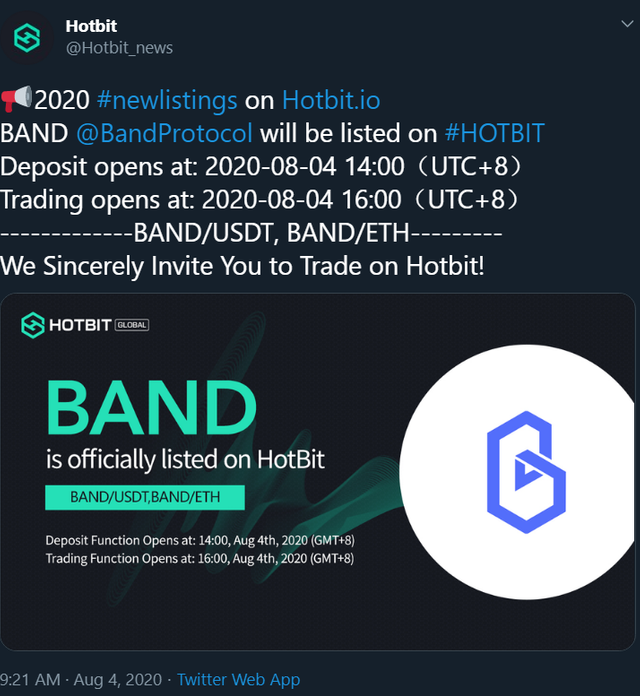
https://twitter.com/Hotbit_news/status/1290503199904784385
Coinbase Pro Lists Band Protocol (BAND):
https://twitter.com/BandProtocol/status/1291133092288065536
XT exchange Lists Band Protocol (BAND):
https://twitter.com/XTexchange/status/1293061925115289602
The first announcement was added on the 31st of July and if we see the market cap of Band protocol on 31st July then it was 86.7 million dollars and now it is 302 million dollars. So market cap has increased by 248%. If we observe the volume of Band token then on 31st July it was 16.5 million and now it is 124 million dollars. So the volume of Band protocol is also increased by more than 650%. So after watching such a big jump in market cap and the volume as well we can have an Idea how many traders and buyers are interested to buy and hold this token.
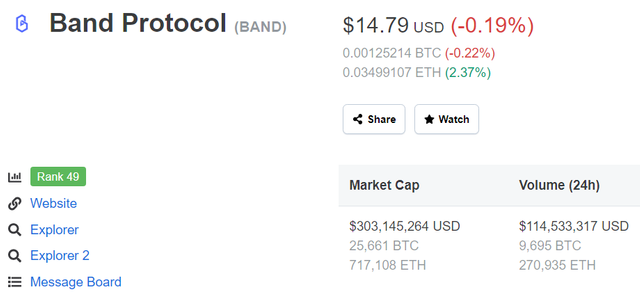
https://coinmarketcap.com/currencies/band-protocol/
The effect on the charts:
Now if we take a closer look at the live daily chart then on 31st of July the Band protocol was moving sideways with the lowest price of $3.9 and the highest of 4.36 dollars. Then it started moving up and on the 10th of August, the price action spiked beyond $17 and surged more than 350% more.
The distance between SMAs and price action:
Now if we place different simple moving averages on the daily chart with the time period of 25, 50, 100, and 200. Then price action is above all these moving averages but there is a big distance between the SMAs and priceline So there can be two possibilities that the priceline may move down to use at least 25 simple moving average as a support before the next rally or the price action will move more up from this level as the way the candlesticks are being consolidated after 10th of August is likely to be a flag. In the second case, the 25 simple moving average can move up to provide the support to price action.
A symmetrical triangle on 4 hour chart:
If we switch the chart to a 4 hour time period in order to take a closer look. Then the priceline is in fact moving in a pennant that is more likely to be a symmetrical triangle. The price is at the end of this tringle as it has squeezed so much. Now within the next few hours, we can see whether the priceline will breakout from the triangle or breakdown the support.
Click here to create free account on tradingview to watch and play the chart on realtime
Conclusion:
As the priceline of Band protocol is forming different bull flags on the daily chart since it has started bullish rally after March 2020
But price action has no support of any simple moving average. Therefore there is also a possibility that the priceline won’t form a bull flag and move down to use any of the simple moving averages as support. But the continuity of the bull flags is signaling that the priceline will go for the next bull flag rather to break down the support of the triangle.