Steemit Crypto Academy | Course 2 | How To Read Candlestick Charts In Different Time Frame & Information about Buy-Sell(Support & Resistance).
Hello Steemian,
This Homework post is of course 2 provided by @stream4u.
In this post, I will be sharing my thoughts on candlestick charts,
I hope you will get some valuable information from this post.
Lets Began...
 Thumbnail created on snappa.com
The below Homework given by our professor: @steam4u
Explain what is the meaning of the Green and Red candle and how to read the Green and Red candle, with candles image.(Screenshot Needed)
Explain with Candle Chart, what are the time frames available that we can set into the chart, and why it needs to change the candle time frame? (Screenshot Needed)
Show any particular asset candle chart in a different time frame and explain in short what you see in the chart, like which trend we see, what are the price levels. (Screenshot Needed)
What type of traders available in the market, explain how they work?
In trading or investing in assets, what is the importance of Support and Resistance, explain how they work?
How we can find the Support in the candle chart, explain with one of the asset Candle charts with screenshot and point the levels. (Screenshot Needed)
After finding Support, when and where we need to place a buy order, explain with a chart screenshot? (Screenshot Needed)
The below homework is submitted by @y0gi
Explain what is the meaning of the Green and Red candle and how to read the Green and Red candle, with candles image.
Ans: Explain with Candle Chart, what are the time frames available that we can set into the chart, and why it needs to change the candle time frame?
Ans: - Show any particular asset candle chart in a different time frame and explain in short what you see in the chart, like which trend we see, what are the price levels. Ans:
- What type of traders available in the market, explain how they work? Ans:
- In trading or investing in assets, what is the importance of Support and Resistance, explain how they work? Ans:
- How we can find the Support in the candle chart, explain with one of the asset Candle charts with screenshot and point the levels. Ans:
- After finding Support, when and where we need to place a buy order, explain with a chart screenshot? Ans:

✔️Green and red candles indicate the market trends whether it is going downwards or upwards.
✔️The Green Candle starts at 50$ and ends at 80$ this candle is showing upwards trends means profit.
✔️ The red candle also starts at 50$ and ends at 30$ this candle is showing downwards trends means loss.
✔️Candle chart helps us to understand the market trends.
✔️There are different types of time frames like:
1M, 5M, 15M, 30M, 1H, 1D, 1W & Etc
◽️ M stands for Minutes
◽️ H stands for Hours
◽️ D stands for Days
◽️ W stands for Weeks
✔️The User can change candle time as per needs because every candle time frame has its own presentation depends upon the trend of the selected product.
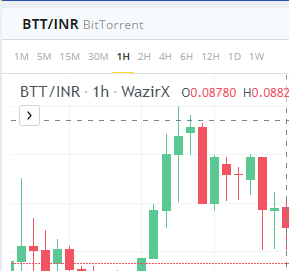
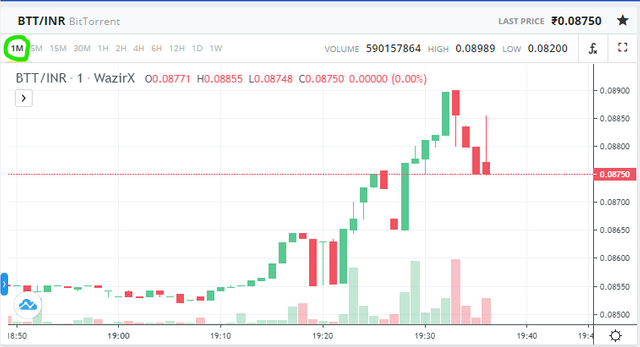 Image Source
🔹The above screen tells us about the BTT is hitting 0.08900 at 19:00 (Time), This candle chart is running upwards, Slightly fluctuation has been noticed by that is be considered in the market.
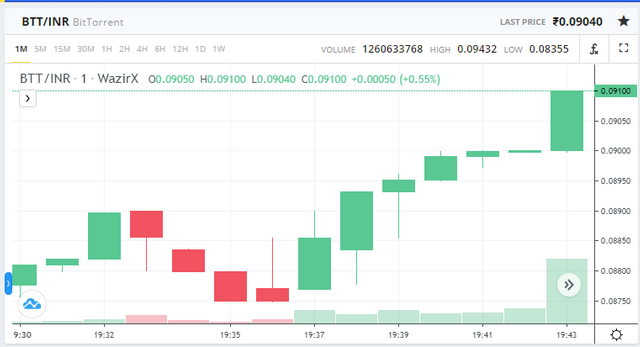 Image Source
🔹The above screenshot is of BTT and the candle chart is of 1M (Minutes), The charts will help us to notice ups and downs on every minute, Around 19:35 (Time) the trend was downwards but around 19:43 (Time) the trend started growing upwards.
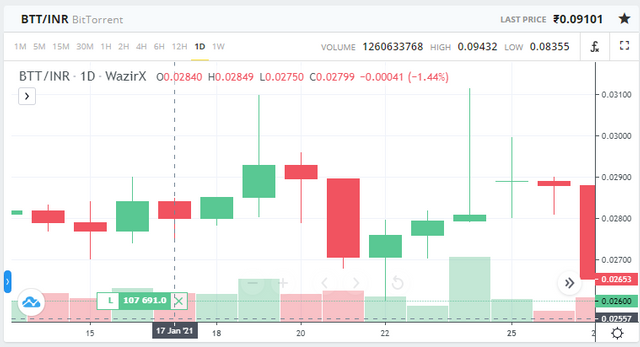 Image Source
🔹 The above screenshot is of BTT and the candle chart is of 1D (Days), The charts will help us to notice ups and downs on every days, We can notice downfall on 21-Jan-21 and the top upwards was on 19-Jan-21 at price of 0.02929.
✔️There are basically 3 types of traders
1. Day Trader
2. Short Term Traders
3. Long Term Traders
1. Day Trader
🔹 Day traders are the one who keeps an eye on the 1M to 1H candle charts and they are looking for a profit and they sells immediately when they see profit, They are also called as intra-day traders
2. Short Term Traders
🔹Short term traders are trading on monthly basis they wait for a good hike in the profit and then they sells the shares, This types of traders are preferring to view monthly/weekly candle chart.
3.Long Trem Traders
🔹This types of traders look for a less costlier coins and they assume in coming years the price of there coin is going to boom up the market, Mostly this types of traders prefer to analyze the coin thoroughly before investing.
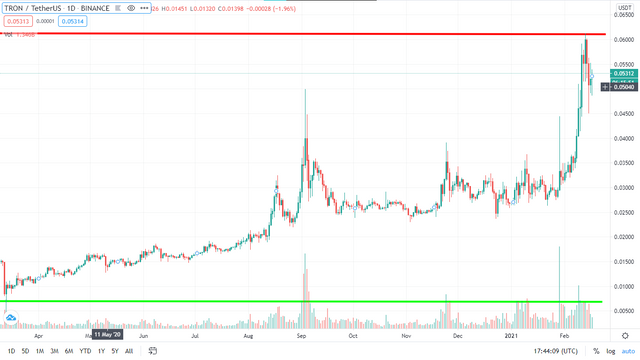 Image Source
🔹Red line is showing Resistance of the trend, Basically resistance means what is the hightest point of the assets.
🔹Green Line shows the support in the above chart, Support means what is point from where the asset is not going downwards, At the point of support the asset is majorly going upwards.
🔹Support & Resistance are the two factors which helps to identify the future trends of the assets, Majorly Traders prefer to buy the asset at the support level and Sell the same asset while it reachs the resistance.
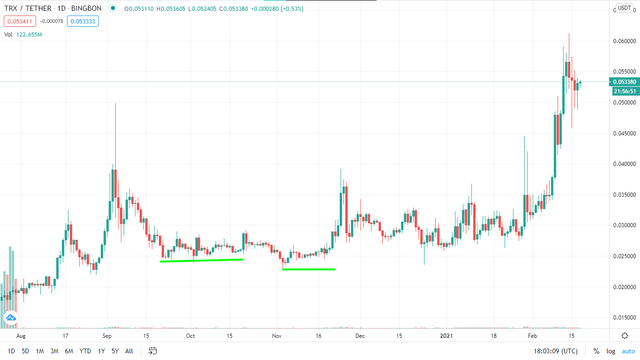 Image Source
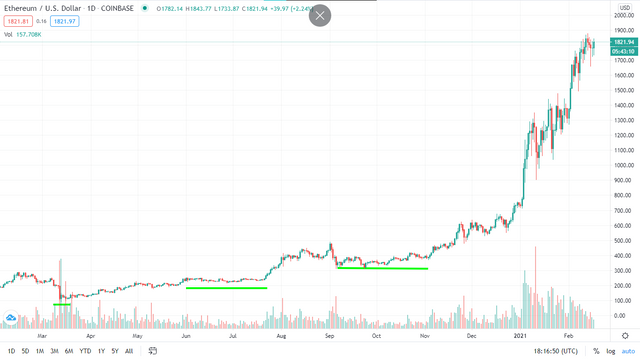 Image Source

Cheers🍻
Let's Connect👉 @y0gi😁
Thank You for reading my post
✅My posts & comments are set to power up to 💯%. Your contribution would be very much appreciated.
🤩Excited to see your positive comments.
#technicalcryptosr #cryptoacademy #steemexclusive #india #steemit
Hi @y0gi
You made a good post on Homework task 2, explained it very well.
Thank You For Showing Your Intrest in Steemit Crypto Academy
You have completed the homework task and made a good post, explained very nicely about How To Read Candlestick Charts In Different Time Frame & Information about Buy-Sell(Support & Resistance).
Remark: Homework Task Completed.
Thank You.
@stream4u
Crypto Professors : Steemit Crypto Academy
Thank You @stream4u,
Thank You for your remark
🍻Cheers
Lets Connect👉🏻@y0gi
Steeming India Community: (Member)
#india #steemit #affable #Steem #twoprecent