Steemit Crypto Academy - Season 2, Week 8 // The Wyckoff Method by @fendit // Homework done by @xkool24 //
Hello friends, Good to be here as I participate in today's lecture posted by my Respected Prof @fendit on her lecture on Wyckoff Method. I will be attempting this homework task to the best of my knowledge.

QUESTION1: Share your understanding on "Composite Man" and the fundamental laws. What's your point of view on them?
The Wyckoff method which was seen to come into limelight in early 19's with some pronounced trading strategies and principles postulated to help investors and traders maximize their profits during market trends. Though this method was initially used only for the stock markets, but has been seen in use all over other financial markets. In his continued research in this methodology, he was able to come up with different outstanding techniques and theories which included the following;
- The Fundamental Laws
- The Composite Man
- The Wyckoff's Schematics also known as the Methodology for Analyzing Charts
- The Wyckoff's 5-step approach
For me this is one of the most strategic technical tool postulated by Wyckoff. This method is alittle more direct as it gives an insight on how a trader should view the market as a single entity to enable him have some form of controlling entry and exit positions. This imaginary entity created by this concept is largely seen from the representation of some key players greatly decides the position of the market trend at a given time. This key players in the market maybe viewed as wealthy individuals or institutions with heavy presence of fiat or coin holders whose primarily responsibilities are to buy in when market is low and exit its positions when prince is high, hence maximizing profits.
Each time I read up the composition of the Composite Man who have in it some wealthy key players, I remember the activities of the Telsa CEO_Ellon Musk whose activities has continued to cause both bullish and bearish trends lately. The activities here are seen to be in the opposite of the common investors in the market because its interest maybe tailored towards taking advantage of the market trend at a given time. The activities are somewhat seen to have a best explanation while analyzing a simple Market cycle with four (4) main phases.
- Accumulation
- Uptrend
- Distribution
- Downtrend
a). The Accumulation is the first entry position for the composite man even before the other retail investors where alot of the accumulation and buy in positions are done. This accumulation of asset is done in such a gradual way that it does not affect the side movement trend that is seen earlier in this position. But as soon as there is more demand of this particular asset vis-a-vis the supply, price and value of asset is seen in the bullish/upward trend.
b). The Uptrend is the aftermath of the gradual accumulation of asset which sees demand exceeds supply. This is evident because of the holding capacity of the Composite man and also other entry positions because of the uptrend already seen in the market movement. As the market keeps gaining more entry and buy-in positions, it is saddled with different accumulation points which may be seen as re-accumulation positions. All this point of uptrend to the re-accumulation and Distribution are potential profit margins for the composite man and other retail investors/Traders in the market. It is a pure economic path that when demand of an asset exceeds its supply, prices are seen to shore up. This is the exact forces that guides the uptrend positions in this cycle.
c). The Distribution is always seen as the peak of the uptrend where the demand>supply position has tarried to which now makes the major accumulators of this asset (Composite man) to start shedding off some of their assets (known as distribution) by selling to incoming and late investors into the market. Remember at this point, the Composite man is at at the peak of its profit margin and hence any asset sold means more returns to him. Just as seen in the accumulation position, the distribution position also follow a gradual sideways movement trend which sees the composite man sell off his assets. Just as we know, there would be a time when demand is met to all investors making entry positions into the market and hence having more supply (Supply>Demand ) which triggers a downward trend.
d). The Downtrend movement is quickly triggered given to the activities of the Composite man in the distribution point. With the activities seen in the distribution, market reverts itself because there are excess supply of assets. Just as seen in the accumulation where there are points where there are stops which represents re-accumulation, so is the distribution with its redistribution. This points are known to be market weak bull-reversals which also see it being bearish.
The Wyckoff concept is also seen to work with some fundamental laws to give is postulation a better fit to traders and investors during trade. There is no doubt that it has contributed to the the widely acceptance seen in adopting its concept. There are three (3) fundamental laws in cognizance with the Wyckoff Method seen below;
- The Law of Supply and Demand
- The Law of Cause and Effect
- The Law of Effort & Result
a). The Law of Supply & Demand has been a law that has guided the traders/investors using the Wyckoff's method. In this law, when demand of a given assets exceeds the supply required to satisfy this need, prices are seen to go up. But when supply is seen to be more than demand, prices of same assets is seen to be low. This law is completely effective in Wyckoff method as investors are to work with price action and volume bars as a tactical means of determining supply and demand movements. As soon as this is ascertain, traders/investor are in a better position to know the next line of market trend.
Quick Highlights:
- Demand < Supply = Prices are seen to Drop (Downtrend/Bearish)
- Demand > Supply = Prices are seen to Rise (Uptrend/Bullish)
- Demand = Supply = Prices are seen to be in equilibrium (There are low or no Price volatility)
b). The Law of Cause and Effect is also another fundamental law that guide the investor and gives him an insight on market trends. The law of cause clearly states that the difference between demand and supply are not random rather it comes after some level of preparations and events occurrence. For instance, in the chart cycle I earlier demonstrated where the initial stage is seen to be the accumulation and ended with the Downtrend, clearly shows the use of this law in this concept. In applying this Law in Wyckoff Concept, the Accumulation of asset seen in the first entry position where the Composite man is seen to accumulate more asset is seen as the CAUSE and the Uptrend movement is the EFFECT. Also, the Redistribution is seen to be the CAUSE with the Downtrend being the EFFECT.
c). The Law of Effort & Result simply tells us here that changes seen in the price of an assets resultant effect of an Effort which is dependent on the trading volume. Therefore when we see the price action and volume in a state of harmony, market trend will continue to maintain status quo. But when there are price action and Volume divergence, trends are seen to be either bearish or bullish as the case maybe. When there are an increased volume in trade, it simply shows the EFFORT and represents more trading activities in trade which may see a price uptrend that represents RESULT.
QUESTION2: Share a chart of any cryptocurrency of your choice (BTC or ETH won't be taken into account for this work) and analyze it by applying this method. Show clearly the different phases, how the volume changes and give detail of what you're seeing.
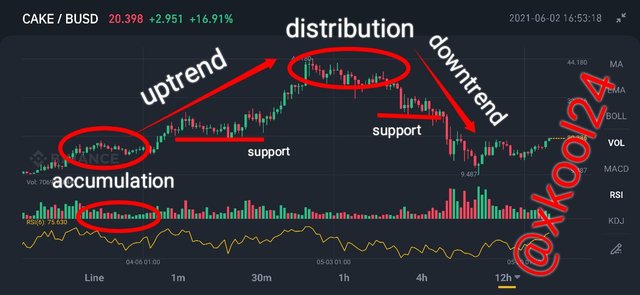
I selected the CAKE/BUSD pair for the purpose of this chart post with a 12H time-frame. The Wyckoff cycle where all the phases was indicated in the screenshot with possible sights of supports which can be tagged re-accumulation or re-distribution.
-The Accumulation phase was well captured with side-way movements with little market volatility in play. For the Composite Man, this is his best time and entry position to accumulate all the assets at his disposal. Price changes here are low given to the gradual accumulation process in view. Trade volume too is seen to be infinitesimally noticed though growing at a gradual rate.
- As this accumulation continues, the demand is seen to outweigh supply and hence the natural course for an UPTREND movement is seen just as captured in the screenshot. This will significantly show an increase in volume traded as asests are seen to exchange hands given to the massive accumulation seen from the composite Man. Just as captured, there are points were we have RE-ACCUMULATION which can be seen as support too. Market is seen to re accumulate as other retail investors are seen making entry position due to the uptrend movement. For the Composite Man, all the uptrend movement are Profit margins for him to maximize sells, and for other short term investors who made early entry positions.
- In the Distribution point, some investors are seen also making late entry into the market and at this point there are quick sell-offs from the composite man which continues for a while until Supply is seen to outweigh Demand. Market trend is seen to be sideways as it gradually sell of asset. And when this occurs, we can see the result in a downtrend movement as asset would continue to loose value.
- The DOWNTREND movement would continue due to the Distribution activities seen where there are shed offs from the Key and major market players. We also captured the Re-distribution position as price of assets continue to be bearish. Trading volume is also seen to drop hence the price drop in CAKE/BUSD
Wyckoff concept has been greatly put in use as a technical indicator due to its wide adoption and reliability during trade. It's workability that see it's postulation rely on existing fundamental laws like the demand and supply law, cause and effect law and effort and result law reassures investors of its superiority vis-a-vis other technical indicators.
Thank you Respected Prof @fendit, this is my entry.
Written by:@xkool24
Thank you for being part of my lecture and completing the task!
My comments:
Very nicely done :)
I really enjoyed going through your work.
Still, I only have a small correction, and that's in your chart. You showed two supports in the uptrend and downtrend, yet they're reaccumulation and redistribution phases!
Overall score:
8/10
Yes prof, I know about that...maybe wrong labelling. I described them as re-accumulation and re-distribution in my analysis.
Thanks always for your review.