On-chain Metrics(Part-3)- Steemit Crypto Academy- Season 4, Week 5- Homework Post for @sapwood

Hello friends and welcome to my assignment task by professor @sapwood, In this assignment, I will be working on Onchain Metrics(Part-3). I hope you enjoy my assignment.

Question (1)
How do you calculate Relative Unrealized Profit/Loss & SOPR? Examples? How are they different from MVRV Ratio(For MVRV, please refer to this POST)?
- How to calculate the Relative Unrealized Profit/Loss(RUPL)
Before I delve into explaining this it will be good to get a recap of the definition of Market Cap and Realized Cap,
Market Cap: Market Cap is the multiplication of the circulating supply of an asset by its original price. For example, Bitcoin has a current price of $53,790.88 per unit and also has a circulating supply of 18,837,762.00 BTC, therefore to calculate its Market Cap = Circulating supply x Current price
Market Cap = 18,837,762.00 x 53,790.88 = 1,013,299,795,210.5599
Therefore the Bitcoin Market Capitalization = $1,013,299,795,210.5599
Realized Cap: Realized Cap is the overall value of the UTXO based on its price since it was last traded. it is calculated using this formula below:-
Realized Cap=value⋅price created [USD] (of all UTXOs)
source
Let's take for example 200 pieces of Bitcoin was left in a wallet after transactions have been made over the years. let's say, that 100 Bitcoin was not moved from the wallet address after a transaction since 2018 with the value at then being $10,000, also 60 Bitcoin was not moved from the wallet address after a transaction since 2019 with its price at then being $4,000, another 40 Bitcoin was not moved from the wallet address after a transaction since 2021 with its price at then being $54,000.
To calculate the Realized Cap = (100 x 10000)+(60x 4000)+(40 x 54,000)
Therefore Realized Cap = 1,000,000 + 240,000 + 2,160,000 = $3,400,000
Realized Cap = $3,400,000
To be able to find out the Relative Unrealized Profit/Loss we first have to find the Unrealized Profit/loss which is gotten by the difference between the Market Cap and the Realized Cap. This helps to identify the total profit/loss made over a crypto asset. Therefore to calculate the Unrealized profit/loss = Market Cap - Realized Cap.
I will be Using the values of the Market Cap and Realized Cap above to calculate the Unrealized Profit/Loss
Therefore UPL = $1,013,299,795,210.5599 -$3,400,000
therefore the Unrealized profit/loss = $1,013,296,395,210.55
Since the Value is Positive it is deemed an Unrealized Profit.
Therefore to calculate the Relative Unrealized Profit/Loss we have to divide the Unrealized Profit/loss by the Market Cap, this helps to identify and evaluate the emotions of investors over time for a particular crypto asset.
Therefore the Relative Unrealized Profit/Loss can be calculated using this formula - RUPL = (Unrealized Profit/loss)/Market Cap
I will be using the values of the UPL and Market Cap above.
Therefore the RUPL = $1,013,296,395,210.55 / $1,013,299,795,210.5599 = 0.999996644625789
Therefore the RUPL = 1.0 (to 2 s.f)
The RUPL identifies when crypto assets are in the Profit or Loss zone when the value of the crypto asset is far above zero, for example, our calculation above shows that the price of BTC is at 1.0 level, this indicates that the asset is in the profit zone and investors should take profit and also should anticipate a price decrease, also when the value of the asset is far below zero it indicates that the crypto asset is in a state of loss and investors should start buying.
- How to calculate the Spent Output Profit Ratio(SOPR)
What is the SPOR
The SPOR is an on-chain metric indicator that determines the amount of profit, loss, or the Net mutual transaction ratio of spent UTXO balance with respect to the current market price of a Crypto asset. This means it can help to identify Local Lows, Sustained lows or Capitulation, Local Highs or Profitability, and Sustained highs or Profitability within a Bull or Bear Market of a Crypto asset.
- How To Calculate the SPOR
The SPOR is calculated by dividing the Fiat valuation of all the UTXO that was traded on a particular day by the Fiat value of the UTXO since when they were last moved.
Therefore SPOR = Value of UTXO spent/ Value of UTXO since last spent
For example, let's say Bitcoin has a spent UTXO of 5 at a Market Price of $54,000, while the 5 UTXO since last spent was $30,000.
Therefore SPOR = Value of UTXO spent/ Value of UTXO since last spent
where Value of UTXO spent = 5 x $54,000 = $270,000
where Value of UTXO since last spent = 5 x $30,000 = $150,000
Therefore SPOR = 270,000 / 150,000
SPOR = 1.8.
The illustration above it shows the SPOR has a reading above 1 which indicates that the investor is in profit, likewise if the price ratio is below 1 it signifies that the investor is at loss.
- How are the RUPL and SPOR different from MVRV Ratio
The Relative unrealized profit/loss (RUPL) identifies the difference between the Realized Cap and the Market Capitalization and identifies the contrast or division between their outcome which is the Unrealised Profit/Loss to the Market Cap.
The Spent Output Price Ratio (SPOR ) identifies the Profit, Loss, and Net mutual transaction ratio of spent UTXO balance with respect to the current market price of a Crypto asset.
The MVRV (market-value-to-realized-value) identifies the fair ratio of an asset by comparing its Market Cap with its Realized Cap, thereby signaling if the asset is undervalued or overvalued when its price has crossed below or above its fair value.
Question (2)
Consider the on-chain metrics-- Relative Unrealized Profit/Loss & SOPR, from any reliable source(Santiment, Glassnode, LookintoBitcoin, Coinmetrics, etc), and create a fundamental analysis model for any UTXO based crypto, e.g. BTC, LTC [create a model to identify the cycle top & bottom and/or local top & bottom] and determine the price trend/predict the market (or correlate the data with the price trend)w.r.t. the on-chain metrics? Examples/Analysis/Screenshot?
- Relative Unrealized Profit/Loss
The Relative unrealized profit/loss (RUPL) identifies the difference between the Realized Cap and the Market Capitalization and identifies the contrast or division between their outcome which is the Unrealised Profit/Loss to the Market Cap.
The RUPL makes movements that could be above or below zero, when the RUPL makes readings above 0.75 it signifies that the asset is approaching a potential profit zone or a Historical Peak.
Likewise, when the RUPL makes readings below the 0.00 range, it signifies an approach to a potential bottom or Historical bottom.
-RUPL under a 5-year timeline
- Historical Cycle Peaks
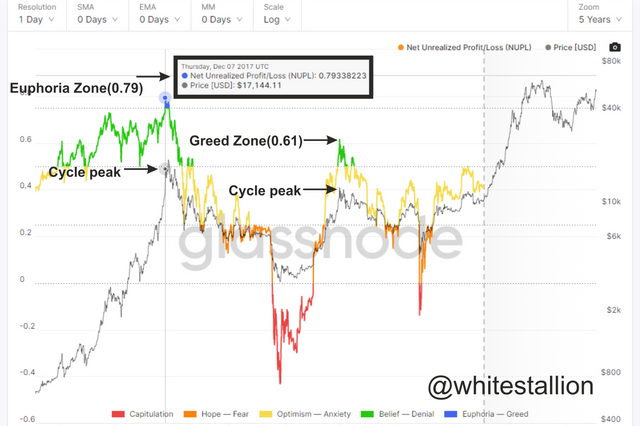
The image above shows The RUPL on the Bitcoin chart. The RUPL hit the Euphoria zone at 0.79, with Bitcoin price at $17,144.
With Price hitting a Historical Cycle peak and the RUPL encroaching the Euphoria zone, the price was of Bitcoin plunged back to the Historical Cycle bottom and the RUPL diving to areas of Capitulation as investors started to sell in other not to make losses.
- Historical Cycle Bottoms
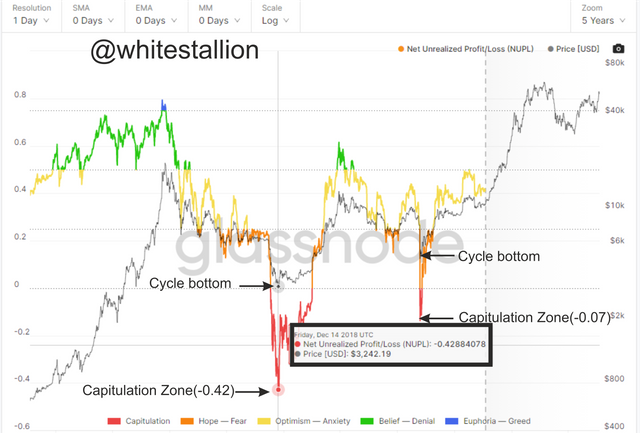
The image above shows the RUPL on the Bitcoin chart, in this chart the RUPL reading was at -0.42 which was at the Capitulation Zone, with Bitcoin price at $3,242.19 which was in the region of Historical Cycle bottoms.
With the RUPL entering the capitulation zone, the price of BTC meet a strong resistance which then initiated a Bull cycle after there was an accumulation of old and new investors. As indicated in the chart above the RUPL moved back to the Greed zone as a result of an influx of investors due to the low price of BTC.
Note: The image above is a chart analysis of Bitcoin.
- Spent Output Price Ratio (SOPR)
As stated earlier the SOPR is an on-chain metric indicator that determines the amount of profit, loss, or the Net mutual transaction ratio of spent UTXO balance with respect to the current market price of a Crypto asset. The SOPR identifies swing levels when the SOPR makes Local readings. When the SOPR reads above 1 it creates the Local high which signifies that the investors are in profit, while if it makes readings below 1 it creates Local Lows which signifies that investors are in loss. The SOPR also identifies areas of sustained profit or Loss, thereby creating Swing highs and lows in price.
-SOPR under a 2-year timeline
- Swing Highs
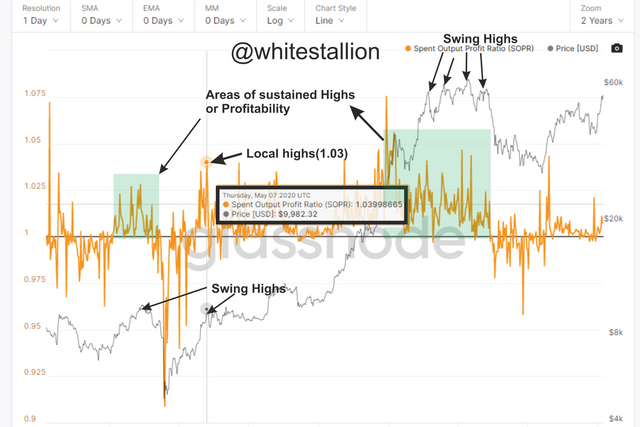
The image above shows that on May 7th, 2020 the SPOR made a reading of 1.03, with the price of Bitcoin at $9,982, thereby creating Local Highs and Swing Highs, this signifies that investors are in profit, thereby initiating a sell-off of the BTC by the investor, causing the price to plunge back below 1.
Also, the SOPR identifies areas of sustained Profitability which is marked by the green box. this area shows that the price of BTC was in a strong Bullish run, thereby creating multiple Swing highs, but the downside to this massive increase in value is that it will initiate a massive sell-off by investors which will make the price of BTC plunge down to the area of Local lows or even sustained Capitulation.
- Swing Lows
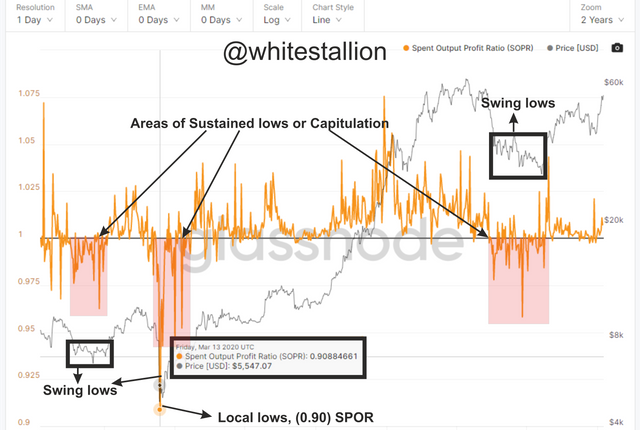
The image above shows that the SPOR made readings below 1 at 0.90 with the price of Bitcoin at around 5k, but this price decrease is a result of the BTC price hitting huge resistance after making swing highs. The SOPR shows that investors wherein massive losses after the SPOR entered a phase of sustained Capitulation.
The Upside to the reading of the SOPR is that old and new investor who still have capital will begin to enter back into the market and as a result of this, a Bull run will be initiated, this could be seen on the chart as Bitcoin rallied up to 63k in price.
Note: The image above is a chart analysis of Bitcoin.
Question (3)
Write down the specific use of Relative Unrealized Profit/Loss(RUPL), SOPR, and MVRV in the context of identifying top & bottom?
- Relative Unrealized Profit/Loss(RUPL)
Relative Unrealized Profit/Loss(RUPL) is an on-chain metrics indicator that helps investors or analysis to identify Historical cycle Tops and Bottoms through its Readings, of which if the RUPL is above 0 deems that investors are in profit and if it moves below 0 deems that investors are in loss.
The RUPL is movements divided into different market sentiments which include Euphoria, Greed, Denial, Hope, Fear and Capitulation, this means that the RUPL can also help to identify the direction the market will take because these sentiment zones interpret if the asset has been overvalued or undervalued.
- The MVRV (market-value-to-realized-value)
The MVRV (market-value-to-realized-value) identifies the fair ratio of an asset by comparing its Market Cap with its Realized Cap, thereby signaling if the asset is undervalued or overvalued when its price has crossed below or above its fair value.
The MVRV makes readings of which if it is below 100% or 0 and 1 signifies that the crypto asset is undervalued, should an investor sell at this region they would be at loss. Also, if the MVRV ratio reads above 200% or 300% it signifies that the asset is overvalued, and should an investor sell at this region they would be in profit. This interprets that the MVRV can be used to mark entry and exit points for investors.
- The Spent Output Price Ratio (SPOR)
The SOPR is an on-chain metric indicator that determines the amount of profit, loss, or the Net mutual transaction ratio of spent UTXO balance with respect to the current market price of a Crypto asset. This means it can help to identify Local Lows, Sustained lows or Capitulation, Local Highs or Profitability, and Sustained highs or Profitability within a Bull or Bear Market of a Crypto asset. The SOPR makes readings of which if it is above 1 signifies that investors are in profit, also if it reads below 1 it signifies that investors are in loss.
Conclusion
The Relative Unrealized Profit/Loss(RUPL) helps investors or analysis to identify Historical cycle Tops and Bottoms through its Readings, of which if the RUPL is above 0 deems that investors are in profit and if it moves below 0 deems that investors are making losses while the Spent Output Price Ratio (SOPR) helps determines the amount of profit, loss or the Net mutual transaction ratio of spent UTXO balance with respect to the current market price of a Crypto asset. Both help track the market's sentimental structures and fair value which in turn help investors to identify when their investments have accumulated either profit or loss. These On-chain metrics in a way play a major role as one of the forces that drive the price of these crypto-assets.

Special thanks to Professor @sapwood