Crypto Academy / Season 4 / Week 3 - Homework Post for [Allbert]-Trading with Contractile Diagonals.

Hello friends and welcome to my assignment task by professor @yohan2on, in this assignment I will talk about Trading with Contractile Diagonals, I hope you enjoy and learn from my assignment.

Define in your own words what a contractile diagonal is and why it is important to study it. Explain what happens in the market for this chart pattern to occur. (screenshot required / Bitcoin not allowed)
While attempting to proffer a solution for the above question, I utilized the class material, as well as some external materials in the search of understanding what “contractile diagonals” are, the first thing I discovered was that they were similar to Elliot Waves; very similar in the fact that it is easy to mistake them. So I hope to use elements that I found as differentiating between Elliot Waves and Contractile Diagonals to thoroughly define what Contractile Diagonals is.
It is also important to note that the term “contractile diagonal” is also a mathematical term used to account for diagonal lines arranged in such a manner that the first line goes horizontal, and the second line is at 45 degrees to it. Something like this below:
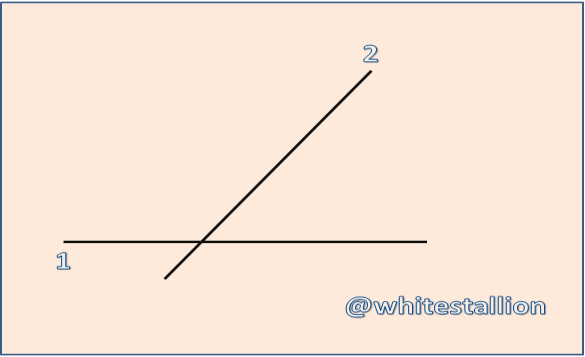
Fig 01: Mathematical representation of a contractile diagonal.
However, this is not the totality of what the term is in the trading market, it basically offers a hint at it. What Contractile Diagonals mean in charts and trade is a collection of impulses in a particular direction (either upward or downward) trend; it is further characterized by a 1-2-3-4-5 wave pattern in that 1,3,5 all move in the direction of the main trend and 2 and 4 basically attempt to correct these impulses. It is this 1-2-3-4-5 wave pattern that makes it similar to the Elliot Wave. However, in an Elliot wave, the 1-2-3-4-5 wave patterns adhere to these rules; such that:
Wave 2 does not retrace more than wave 1
Amongst the waves, 1, 3, and 5, Wave 3 would not be the shortest
And that wave 4 would break the price territory of wave 1.
As seen in the illustration below:
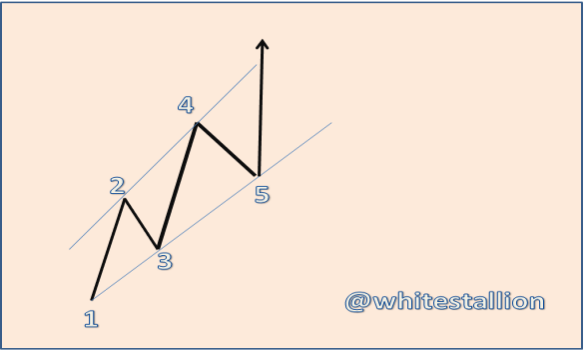
Fig 02: An Elliot Wave illustration.
Just like there are rules guiding the formation of Elliot Waves, there are rules for Contractile Diagonal, however, these rules are in a way that if they adhere, they are legitimately tradable or said to meet the criteria of operability but if they do not, they are said to not meet. The subsequent subsection would illustrate real-life examples of this but the general rule for contractile diagonals is that they precede a change in the trend; meaning that after it occurs, price goes in the opposite direction.
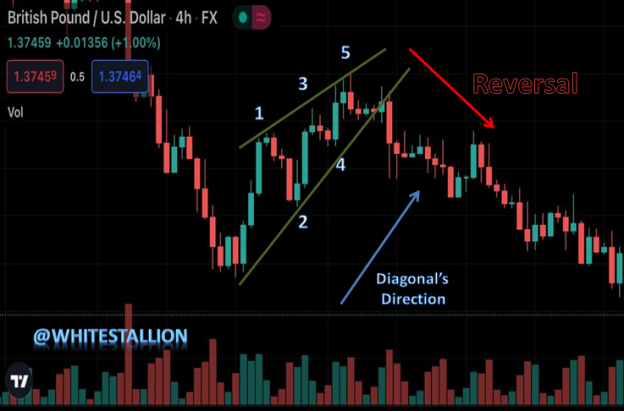
Fig 03: Reversal direction after contractile diagonal. Source: Trading View.
The diagonal lines drawn as seen in the above, act as support and resistance lines in which the waves are limited by until it hits the 5th peak where the price is forced to push beneath number 4 and this part is labeled “the Reversal” indicating once more that price moves to the opposite direction- meaning that if the price had been bullish before, it will go bearish or vice-versa. In the class, this movement is likened to a spring which when compressed downwards (forming the 1-2-3-4-5 posture), bounces back up after being released.
Give an example of a Contractile Diagonal that meets the criteria of operability and an example of a Contractile Diagonal that does NOT meet the criteria.
As stated earlier, there are certain rules that define when a Contractile Diagonal is “operable”; meaning that it is compliant to the rules of contractile diagonal formation, and these rules when adhered indicates that the contractile diagonals are “legitimately tradable and functional” and these rules can be summarized to be:
The length of Wave 1 must be greater than that of Wave 3
The length of Wave 3 must be larger than that of wave 5
The length of Wave 2 must be larger than that of Wave 4
The tracing of the first diagonal must meet points 1 & points 3 and 5, while the second diagonal must join points 2 & 4. (However this is not a strict rule)
The diagonal lines drawn must be drawn in such a way that they may meet at some future points.
These rules are so vital that if one fails, this tool becomes irrelevant in our analysis as there is no guarantee price will obey the rules of a contractile diagonal formation.
Fig 04: an operable diagonal contractile -Trading View.
From the image above, the length of wave 1 is obviously longer than wave 3, wave 2 is also larger than wave 5, and 2 is larger than 4. The diagonal lines touch 1, 3 & 5 and the same with 2 & 4. However, if you scrutinize, wave 2 is slightly shorter in a way that it misses the diagonal line, but this rule is oftentimes neglected and that is why it does not invalidate the operability of the diagonal contractile.
Finally, when you look at the diagonal lines (in lime-green color) they converge as though they would meet at some point before the reversal happens. This is a perfect example of an operable diagonal contractile.
Through your Verified exchange account, perform one REAL buy operation (15 USD minimum), through the Contractile Diagonal method. Explain the process and demonstrate the results and graphical analysis through screenshots. Your purchase data must match your analysis data: such as cryptocurrency and entry price.
For the purpose of attempting this operation, I utilized Binance wallet, after finding trades using Trading view. The prices at the market at this time were largely bearish because most were aligning to BTC and it gave a tough time finding a pair that I could perform a buy operation on. Nevertheless, I took a trade on ADA/USDT and this is how it played out:
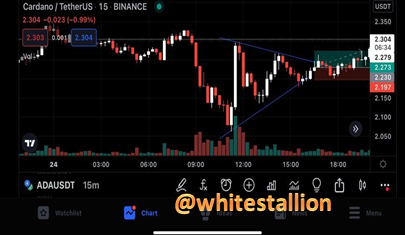
Fig 05: ADA/USDT-Trading View..
Having identified a contractile diagonal, I set TP to be 2.299. Entry: 2.230 and Stop Loss at 2.217 and as can be seen from the chart, price came to hit my TP and I was in profits, below is the result of my trade.
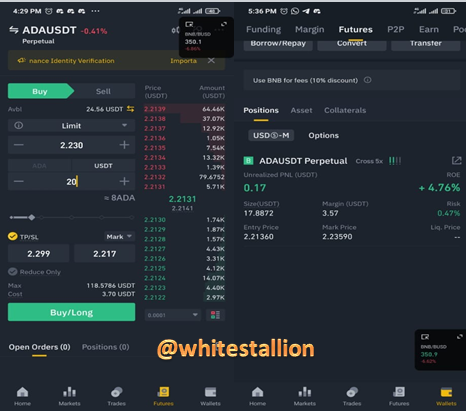
Fig 06: Trade playing out on Binance.
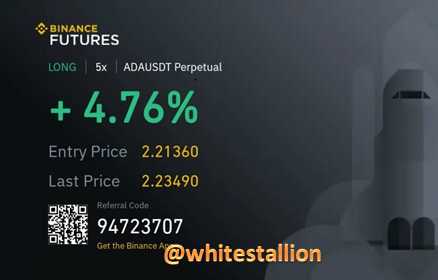
Fig 07: End Result.
During the course of watching this trade play out, it was exciting to watch price move to my zone, nevertheless, I got apprehensive watching candles to move away from my TP, and closed my trade early; accounting for the price above, nevertheless, in a matter of time, price played into my zone, which is displayed in figure 05 above.
Once again, I felt the guarantee in the contractile diagonal analysis, nevertheless, I had initially chosen a trade to run, Luna, with my Entry price at 37.79, Stop Loss at 37.14 and Take Profit at 38.75, nevertheless a big dip in BTC around the hours of 10:00 AM Nigeria time caused my entry to not hit, below is a picture of the analyzed trade.
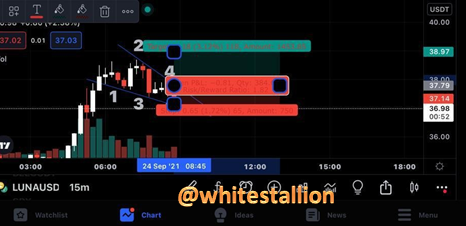
Fig 08: Analysis of Luna/USDT before the dip.
Through a DEMO account, perform one sell operation, through the Contractile Diagonal method. Explain the process and demonstrate the results and graphical analysis through screenshots. Bitcoin is not allowed.
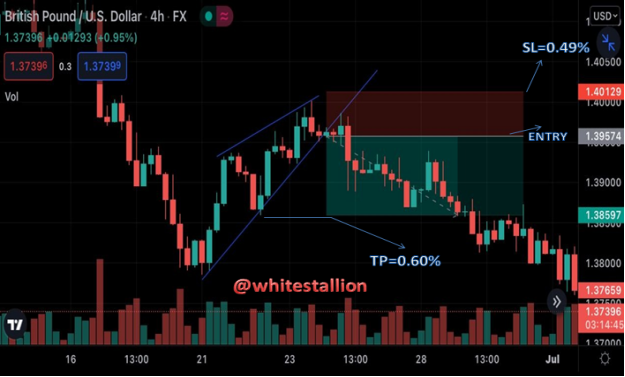
Fig 09: GBP/USD trade. Source: tradingview.com
From the fantastic image shown above of GBP/USD, trade has been seen to go in favor of my analysis. After spotting the contractile diagonals and drew my diagonals, I waited for a break of market structure from the diagonal line in the 5th wave, after monitoring this, I wait for the next candle after this break of structure and that is my entry. I waited because according to the class exercise, not waiting could mean me running into a false signal.
My TP as can be seen above is placed at the point of Wave 2, and we can see that price even pushes way down to the base of Wave 1.
Explain and develop why not all contractile diagonals are operative from a practical point of view. (screenshot required / Bitcoin not allowed)
At the conclusion of my analysis on the trade above (GBP/USD), there was gladness in my heart of how reliable this system can be. Nevertheless, from the explanation in class, there are instances when a contractile diagonal structure may be operable but not still operative from a practical point of view; meaning that though they are operable by meeting all the rules which include the below:
The length of Wave 1 must be greater than that of Wave 3
The length of Wave 3 must be larger than that of wave 5
The length of Wave 2 must be larger than that of Wave 4
The tracing of the first diagonal must meet point 1 & point 3 and 5, while the second diagonal must join point 2 & 4. (However this is not a strict rule)
The diagonal lines drawn must be drawn in such a way that they may meet at some future points.
They will still not be a good trade to hop on for a profitable trader. The question is why?
The answer to this is situated in risk/reward ratio setting. As in the image above of my analysis in the GBP/USD where the risk to reward ratio is 1:2 which is good RRR (Risk/Reward Ratio), but in some trades, the gap between entry and stop-loss could be so wide that the RRR to be used would not be advisable, as said in the class.
“As a general rule, never allow yourself to enter a trade where you have an adverse R/R ratio”Source.
For instance in the chart below of ETHUSD:
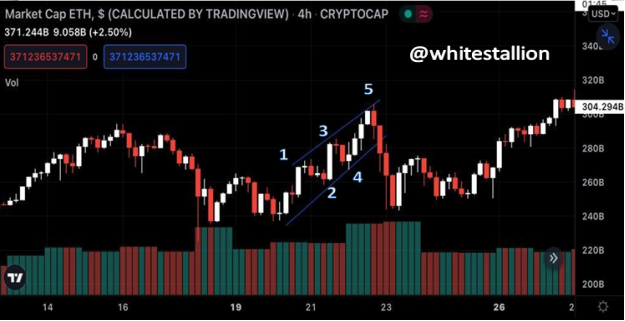
Fig 10: ETHUSD
As labeled, this meets the specifications of a contractile diagonal; in fact, none of the rules are violated, including the lax rule that mandates that the tracing of the first diagonal must meet points 1 & point 3 and 5, while the second diagonal must join point 2 & 4. By all that has been learned here, it feels like a safe trade to take, but let us look below at instances when entry and stop loss is to be made.
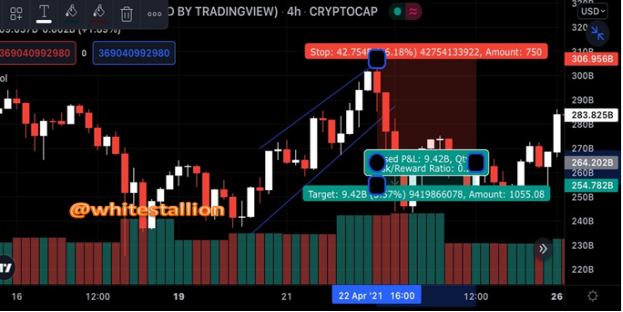
Fig 11: An illustration of an inoperative contractile diagonal
As can be seen, when stop loss is placed at the peak of wave 5, and entry is made at the end of the second candle, with TP at wave 2, that which is to be gained is far lesser than what could be lost, and a good trader has nothing to gain from increasing his risk. Price indeed hits the target price, but immediately it does, it consolidates and heads towards the stop loss again. This further confirms that it was an inoperative contractile diagonal.
Conclusion
From all I have seen personally, this has been the most basic analytical system; nevertheless, it is important to be wary of the rules so as not to make errors in analysis. Contractile Diagonal patterns are so vital in that when accurate, they tell you the next trend in a market. Telling the next trend in the market is beneficial to every trader and it is if not mistaken the most vital part of the analysis. Despite the simplicity of this trading analysis technique, the analyst always has to bear in mind that certain contractile patterns are not tradable by virtue of them missing out on certain rules expected of a contractile diagonal pattern, another rule is that price must remain in the diagonal line; not breaking points 3, 4, & 5; if they do, this renders the analysis untradeable.
All the images used in this post are screenshot extracts from Tradingview and Binance Mobile
Special thanks to Professor @allbert
Hi, @whitestallion,
Thank you for your contribution to the Steem ecosystem.
Please consider voting for our witness, setting us as a proxy,
or delegate to @ecosynthesizer to earn 100% of the curation rewards!
3000SP | 4000SP | 5000SP | 10000SP | 100000SP
@tipu curate
Upvoted 👌 (Mana: 2/5) Get profit votes with @tipU :)
Hello, @whitestallion Thank you for participating in Steemit Crypto Academy season 4 week 3.
Thanks for the review, will do better next time.