Steemit Crypto Academy Season 3 Week 4–Trading The Dynamic Support & Resistance
Let get started
What do you understand about the Concept of Dynamic Support and Resistance? Give Chart Examples from Crypto Assets.
Am sure most of us are familiar with the word support and resistance. If we have been doing crypto academy assignment it's not a new word anymore to us. This are high points ( high/ low) where the price rebounce when it gets to. And also price can also breakout resistance and support levels to change the market trend.
When we talk about the word dynamic support and resistance I think of it as how the price action respect a particular trend. Sometimes we think of the trend lines as resistance and support line. But they are not. We will use exponential moving average commonly known as EMA to study the trend and see how price pays respect to it. We can experience at both resistance and support levels. The main concept is that when price touches the EMA at support level it bounce back and start moving up again and at resistance level also it bounce back and start moving down when it gets to the EMA. That is why the EMA is called Dynamic Support And Resistance
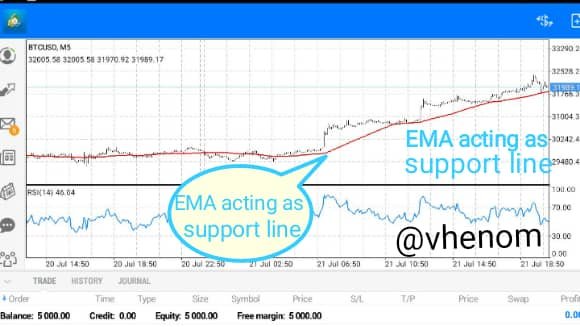
Example of Dynamic Support on Chart
I will be using btcusdt chart of 5min to show example for the dynamic support. You will notice that once the price touches the EMA the price bounce back and keep moving downward. That why the EMA is called Dynamic Support.bellow is a screenshot of EMA acting as dynamic support line
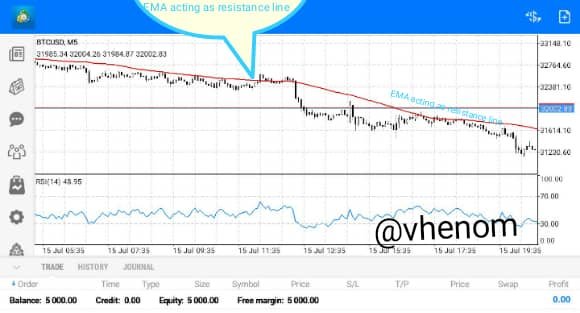
Example of Dynamic Resistance on Chart
I will be using the btcusd chart in the 5min time frame to show example for the dynamic resistance.uou will notice that when the price touches the EMA at resistance level the price bounce Bach and started moving downward again. Below is a screenshot showing the Dynamic Resistance line.
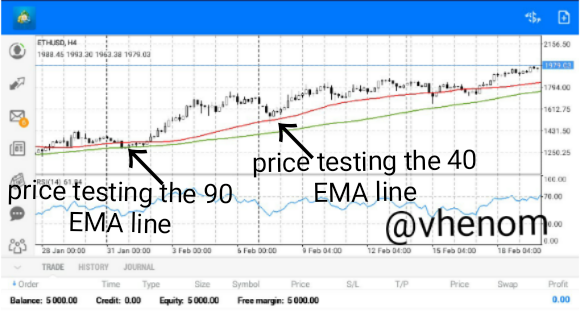
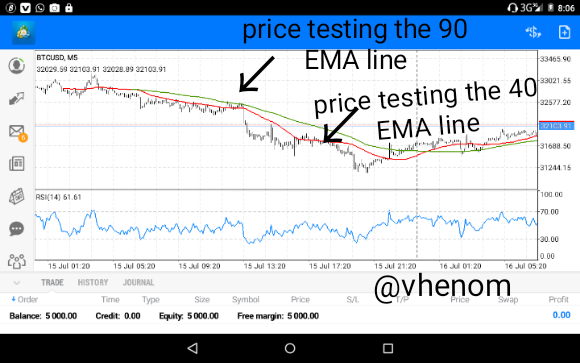
Make a combination of Two different EMAs other than 50 and 100 and show them on Crypto charts as Support and Resistance
I will add the EMA to my metatrader4 market chart and i will be adding 40 length EMA line and the second EMA line will 90 length. That's the combination I will be using to maximise my entry and exit point for good trading opportunities.
To add the EMA line to your chat it's very easy you go to your app which ever you are using to trade go to indicators you will see list of all the indicators the app can offer than you search for EMA. Tap it then you edit it in setting to your choice
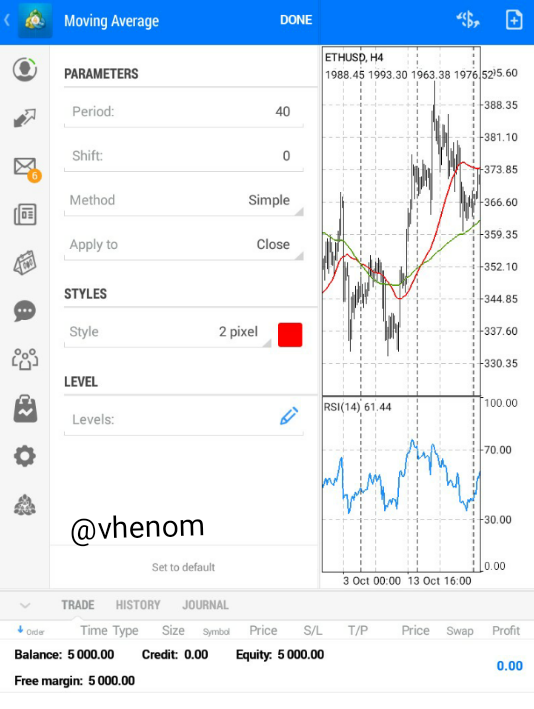
First EMA line at 40
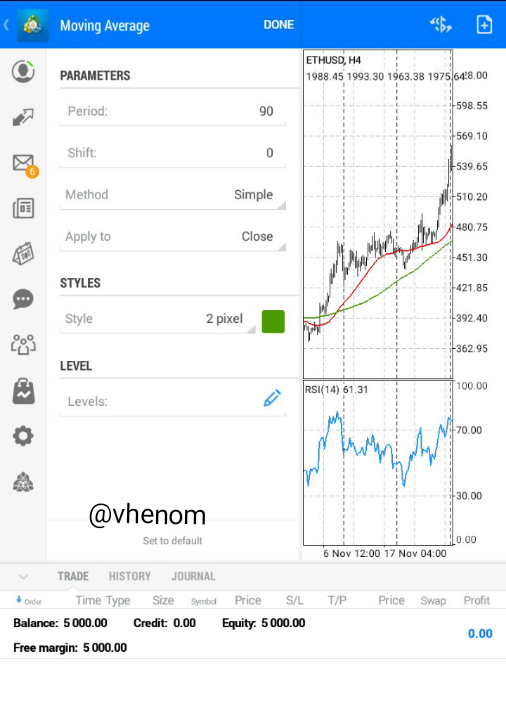
Second EMA line at 90
That's how I edited the lines and I also changed the colour of the one at 90 so it won't cause confusion.
Now let's see the out come of the EMA I added to my chart. One thing I want us to observe is that the price does not cross the 90 EMA line more often as it does for the 40 line. When it crosses the 90 line it's showing another signal right there but I won't talk about that now. I will explain that later.
Explain Trade Entry and Exit Criteria for both Buy and Sell Positions using dynamic support and resistance on any Crypto Asset using any time frame of your choice
I will explain the trade entry and exit for both buy and sell order using the dynamic support and resistance on the market trend.
The two EMA line is used to detect both entry and exit point in the market.
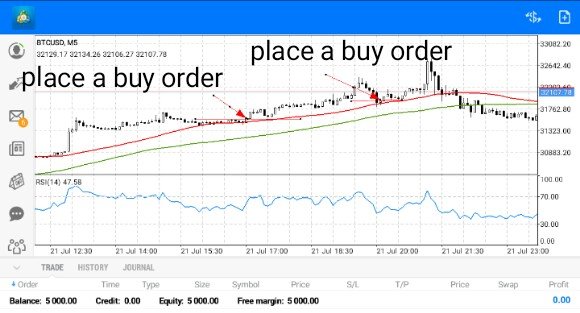
Entry Criteria for Buy Order
To place a buy order using dynamic support you have to consider some following steps so we will place a valid buy order.
- We will add both EMA we are using to the Chart I'm using 40 and 90 EMA line.
- Price must be above both EMA before we can consider a buy order
- Then we wait for the price to retest the 40 EMA but we won't rush into the market directly like that because the price can stroke through both EMA and we will run a loss.
- After the price has tested the 40 EMA and bounce back we can now place our buy order.
- Now we can place a buy order it now more saver than buying it earlier when it is at the 40 EMA.
There are more chances if we lose the first opportunity we can still get more chances in the trade.
Below is a screenshot showing the above illustration.
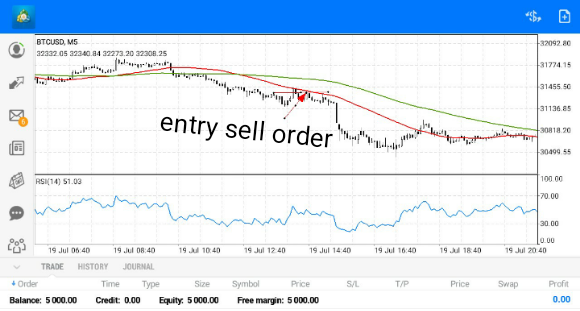
Entry Criteria for sell order
To place a sell order for entry Criteria it's just a similar process. - We will add both EMA to the Chart.
- To place a sell order the price must be below the both EMA. The EMA will be higher the the price.
- We will wait for the price to test the 40 EMA line we won't rush the market. We will wait for the price to bounce back before we place an entry for sell order.
- Now it's saver to place a trade .
Trade Exit for Buy Criteria
- To create an exit for buy order we will have to set a take profit and stop loss
- Our stoploss will get a bit lower to our 90 EMA line.
- We will then set our take profit higher since it's a buy order.
- We will then set a risk- reward ratio 1:1 to maintain a better trade opportunity.
- Once the trade hit our take profit then we know that our setup is valid but if it hit our stop loss then we knows the set up is not valid and we can wait for another setup
###Place 2 demo trades on crypto assets using Dynamic Support and Resistance strategy. You can use lower timeframe for these demo trades
I will place two trade of buy and sell order using the dynamic support and resistance strategy.
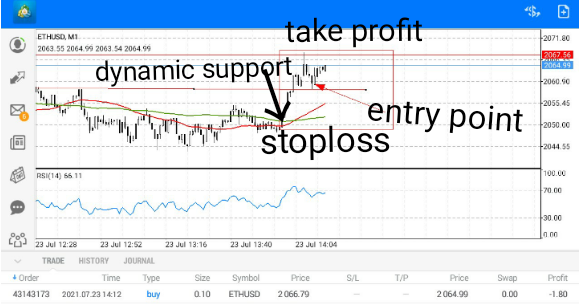
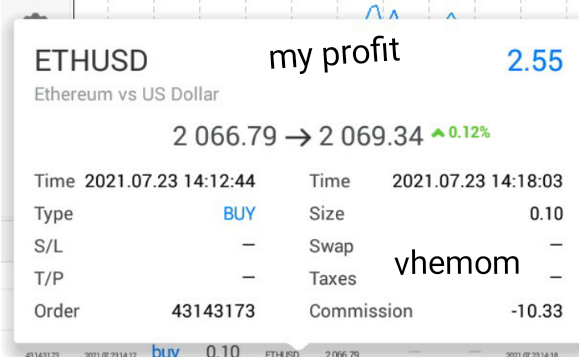
First the buy order I noticed that the price is going high then I wait for it to retest support before entering the market I picked s suitable buy entry position. Then after a while the setup was valid I already made profit . I used the rectangle to mark my stop loss and take profit point. Once it hit my target I closed the trade. Below is a screenshot of the set up.
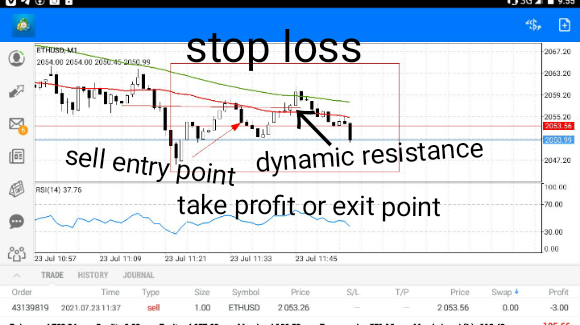
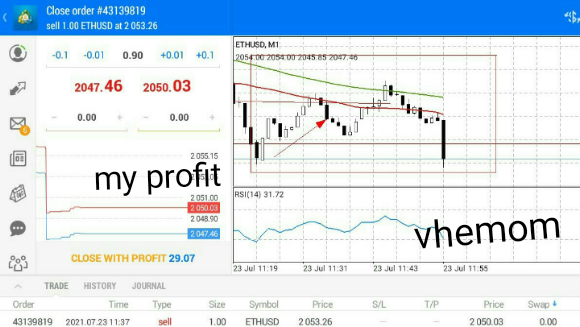
Secondly the sell order I noticed that the price is going down then I wait for it to retest resistance before entering the market I picked s suitable sell entry position. Then after a while the setup was valid I already made profit . I used the rectangle to mark my stop loss and take profit point. Once it hit my target I closed the trade. Below is a screenshot of the set up.
Conclusion
The dynamic support and resistance strategy is very God for pick support and resistance line in the market trend. And the most interesting thing about it is that the follow the price action. So IST very easy to know our support level and resistance level. We can us it for both buy snd sell order. It can be used to maximise trade opportunities.
But we should not for get the two EMA lines they are very important we should not for get to add the two for a good strategy.
CC @cryptokraze
Dear @vhenom
Thank you for participating in Steemit Crypto Academy Season 03 and making efforts to complete the homework task. You got 6/10 Grade Points according to the following Scale;
Key Notes:
We appreciate your efforts in Crypto academy and look forward for your next homework tasks.
Regards
@cryptokraze