[Recognizing Simple Patterns in Trading] - Crypto Academy / S5W2- Homework Post for @sachin08".
IMAGE CREATED WITH CANVA
Hello everyone!
Is another new week of the steemit cryptoacademy season 5. We are in the 2 week of the new season. Professor @sachin08 has made a wonderful lecture about How we can recognise simple pattern in trading, which i benefitted from it. Now lets dive in!.
WHAT IS YOUR UNDERSTANDING ABOUT TRIANGLES IN TRADING. EXPLAIN ALL FORMS OF TRIANGLES IN YOUR OWN WORDS. (SCREENSHOT REQUIRED)
In my own point of view, i will say that triangle in trading is usaully a technical analysis which traders use to predict how market will be in future. This triangel is being drawn with a trendline. When a trader place his or her buy stop over the the resistance point, drawing a straight line above the the chart that serve as a resistance point and drawing the other line which moves upward, located under the price chart, which serve as a support level i.e by doing this, you are predicting the market will go higher after breakout occurs in the resistance level.
This is also similar to when predicting that the market will go down i.e when a trader places his or her sell stop below the support point, drawing a straight line below the chart that serve as a support point and drawing the other line which moves downward, located above the price chart, which serve as a resistance level i.e by doing this, your are predicting that the market will trend down after breakout occurs in the support level.
Triangle are very simple to notice while doing analysis. In other words, a triangle refers to as a repetition of chart pattern, moving up and down between thr resistance and support poiny with making any trend(this is usually called a ranging market) and then till when there is a breakout. Now lets dive in to The forms of triangle in trading.
AS WE ALL KNOW THAT WE HAVE ABOUT 3 UNIQUE FORMS OF TRIANGLE IN TRADING, WHICH I WILL LIST BELOW
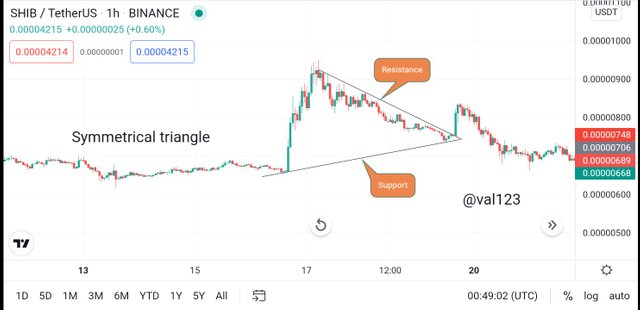
Symmetrical triangle is one of the forms of triangle in trading which is created by two trendline, the one that is moving downwards located at the top of the chart that also at the same time serve as resistance level and the other trendline that is moving upwards located at the bottom of the chart that also at the same time serve as support level. These two trendlines are expected to join together and that makes it a triangle. Futhermore, this trading strategy also help traders to predict the next move or trend of the market price. Below is a screenshot on how Symmetrical traingle looks like.
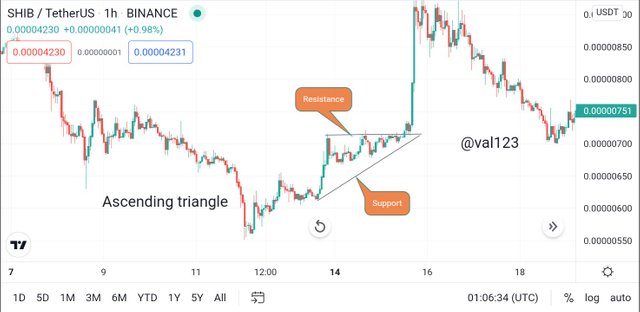
Ascending triangle is one of the forms of triangle in trading which is created by two trendline, the one that is straight located at the top of the chart that also at the same time serve as resistance level and the other trendline that is moving upwards located at the bottom of the chart that also at the same time serve as support level. These two trendlines are expecting expected to join together and that makes it an ascending triangle and it is usally time to buy if there was a breakout. Below is a screenshot on how ascending traingle looks like.
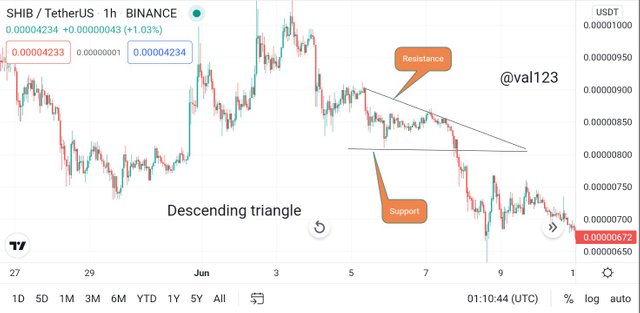
Descending triangle is one of the forms of triangle in trading that is created with two trendlines, the one moving straight located at the bottom of the chart that also at the same time serve as support level and the other trendline is moving downward, located above the chart that also at the same time serve as resistance level. These two trendlines are expecting expected to join together and that makes it a descending triangle and it is usally time to sell if there was a breakout. Below is a screenshot on how descending traingle looks like.
CAN WE ALSO USE SOME INDICATORS ALONG WITH IT TRIANGLE PATTERNS? EXPLAIN WITH SCREENSHOTS.
This indicator is seen on tradingview and other trading platforms, this indicator is mostly used by traders to predict the market. To use this indicator on tradingview, open a chart, click on the indicator button and then search for Half trend. It will show, then click it. As we can see on the chart below, this indicator consist of three lines which are÷
- The central line
- The upper band
- The lower band.
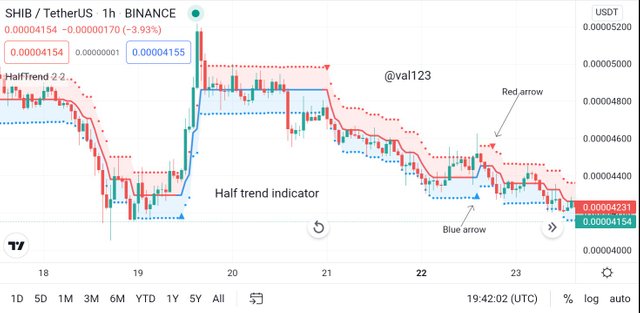
The central line is the half trend itself, then the upper band and the lower band are just placed above the half trend. Now, when the price close over or above the upper band for two or three candle, the central line will turn ro blue colour, meanwhile a small arrove will also show under the half trend. This shows traders that there will be a bullish market. Then, when the price closes under the band for two to three candles, the central line will turn to red colour. Meanwhile a red arrow will aslo show above the half trend. This shows traders that there will be a bearish market. See screen below.
EXPLAIN FLAGS IN TRADING IN YOUR OWN WORDS AND PROVIDE SCREENSHOTS OF BOTH BULL FLAG AND BEAR FLAG.
A flag pattern are pattern of price actiom formed by parallel lines of support and resistance. There are two major types of flag pattern which are the bull flags and the bear flags. Among the two, they are always continuation patterm and they are considered one of the reliable patterns that you can take when providing an entry for you into an existing trend.
BELOW ARE THE SCREENSHOT OF THE TWO TYPES OF FLAG PATTERN
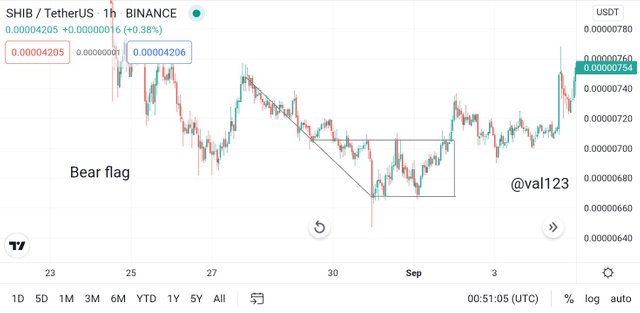
BEAR÷ Bear flags are formed in a bearish price move and they run counter to that. So if you pull back snd up away from the downward of the move. Mostly in the chart, it occurs after a downtrend then the market start ranging. See screenshow below.
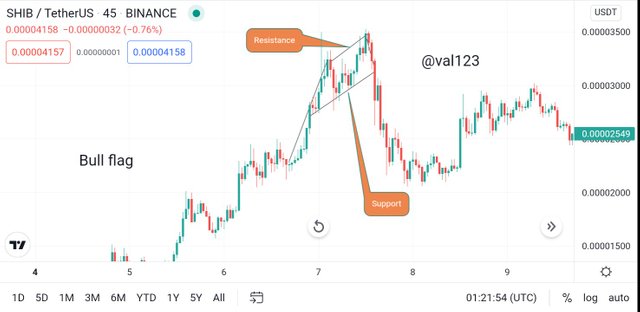
BULL÷ Bull flags occurs in an upward trending movement and you get a pull back to the downside when the buying relaxes. This occurs after an uptrend then the market start ranging. See screenshot below.
SHOW A FULL TRADE SETUP USING THESE PATTERNS ON ANY CRYPTOCURRENCY CHART. (ASCENDING TRIANGLE, SYMMETRICAL TRIANGLE, BEAR FLAG)
ASCENDING TRIANGLE
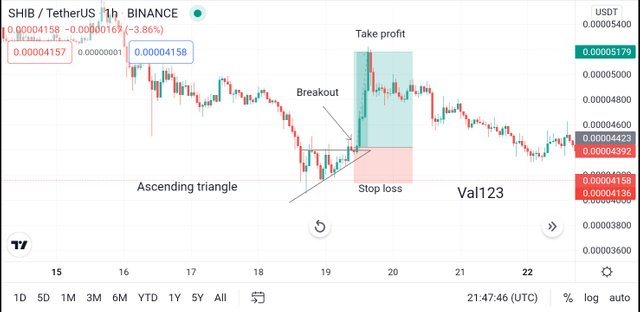
The chart below is an ascending triangle chart pattern. I used this to maie a trade. Looking at the chart below, triangle was drawn using two trendline, the straight line located at the top of the chart, which serve as resistance level and the other line going upward located at the bottom of the chart which serve as support level.
The market crosses the resistance level which lead to a breakout and i took my entry at 0.00004423 , setting my stoploss around 0.000004158. Ao once the price trends up and hot my take profit, it will execute. Meanwhile, if it happens to ve that the market trends down and hit the stoplos, it will execute but am loosing.
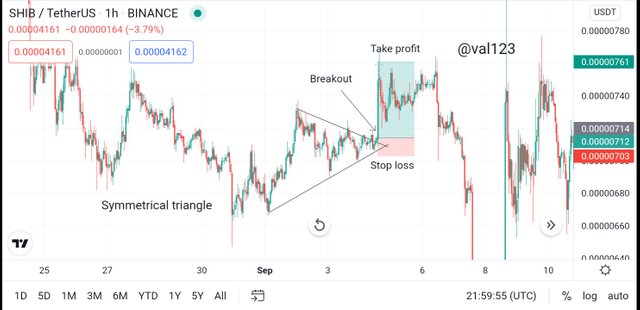
SYMMETRICAL TRIANGLE
Similar with the ascending triangle, seeing the chart below shows a trade i used the symmetrical triangle to perform. I took my entry at 0.00000714 after a breakout occurred, then set my take profit at the top around 0.00000761, then my stoploss at 0.0000703. Once the market hit one of the two, it will execute.
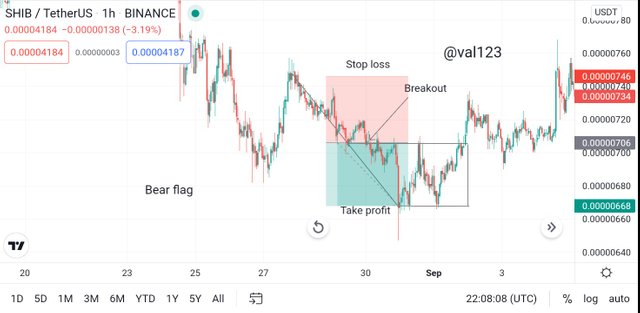
BEAR FLAG
Using the bear flag, i will short the market, this is futures trades, you can predict the market to either to go high or low. So using the bear flag to analyse the matket, i predicted that the market will go down. I took my entry immediately after breakout at 0.000706 set my stop loss at 0.0000746 then the take profit at 0.00006668
CONCLUSION
A trader needs to know all this technical analysis so as to know the right time to enter or exist the market. The lecture was awesome and i learnt a lot.
Cc.
Professor @sachin08