Steemit Crypto Academy week 15 - Home work post for Prof. @yohan2on - The Swing trading style || ETH/USDT Trading Pairs
Thank you very much Prof. @yohan2on for this wonderful lectures. I learnt a new trading style.
Let's proceed to the assignment proper.

QUESTION
Using your knowledge of technical analysis demonstrate your understanding of Swing trading.
MY ANSWER
Before I proceed to analysing of the technical components of the swing trade, it is very important to understand the meaning of swing trading and it's advantages.
What is Swing Trading
This is a type of trading style where a trader studies a trade pattern for days, weeks and months so to capture short and medium profits along the line of those days.
The swing trader basically uses the technical analytical method (indicators) for a time frame, a multiple time frame to spot entry for each trades. So the trader uses the larger time frame to monitor the trend. And Uses the shorter time frame for entry, stop loss setting and profit taking.
Advantages of Swing Trading
It is not time consuming like the scalp trading.
Even without the use of other trade analytical method, traders can just use the technical analysis method tools to carry out the swing trade and make profit.
Disadvantages of Swing Trading
Very high technical know how is required to make profit.
A trade reversal can amount to great loss.
A Crypto asset pair
For the purpose of this lectures I'll be using the ETHUSDT pair.
I choose the ETHEREUM because of it market relevance in the past weeks. It is ranked 2th on the coin market cap. It has a 18.38% market dominance. But the volume of supply shows it is very promising for investment. For the purpose of this assignment I'll be using the https://www.tradingview.com/ for the analysis.
Below is the trade view of ETHUSDT On the
What's your Entry and your exit strategy?
In crypto currency, it is very important to understand the strategy to use. And the understanding of this strategy means that the trader understands the trend Pattern of the chart. Trend pattern is basically the upward(bull) and downward(bear) movement of the chart.
Therefore an understanding of this will help set your entry and exit into the market perfectly. And one of such method is the systematic strategy, which I'll be using for the entry and exit of this trade. This means that I'll be observing the trends and carrying out my swing trade based on the trend progression.
So my strategy will be basically the systematic technical analytical trend pattern observation.
Multiple time Frame analysis.
Now multiple time frame analysis is just the act were a trader analysis the same crypto asset pair but on a different time frame. The swing trader does this most often so to take advantage of the profits involved in this different time frame zones. Below I'll be technically analysing the time frames for a day, 4hours and weekly which is what a swing trader is known for.
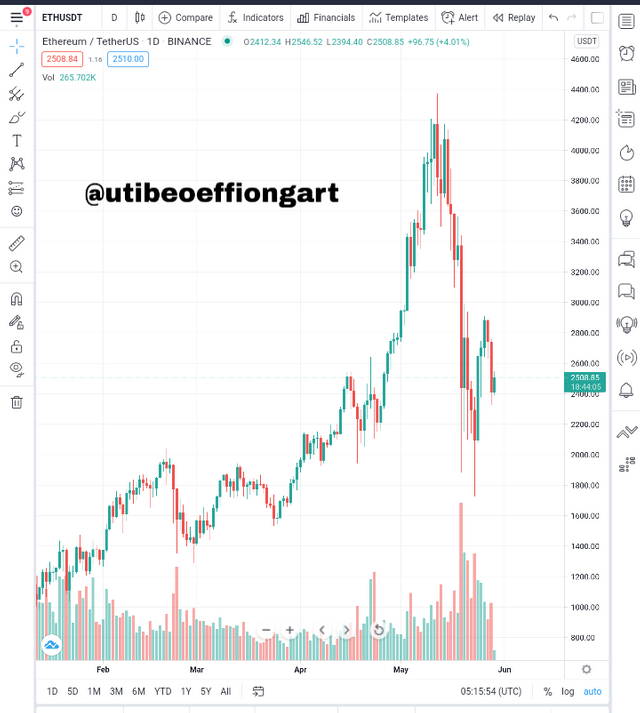
DAY TRADE
Afore is the day trade for ETHUSDT pair. And currently the market is experiencing a significant fall which is a good time to buy.
WEEKLY TRADE
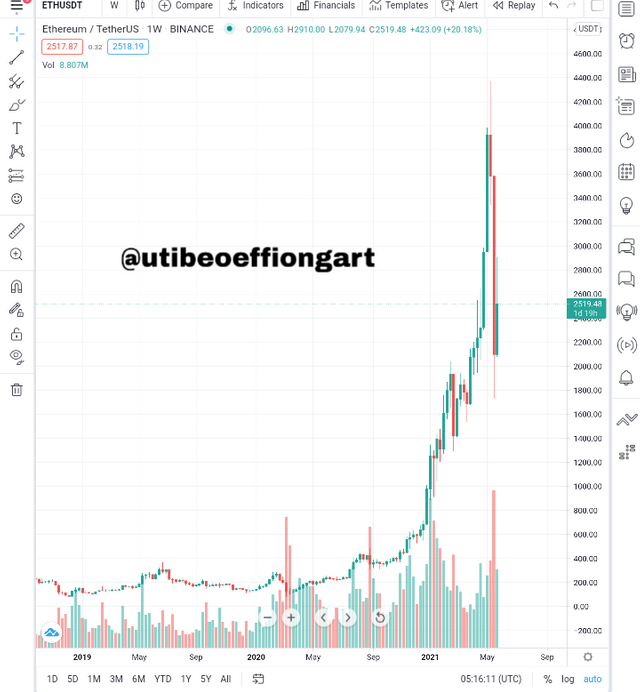
Afore is the trade pattern for Ethereum weekly trend. This gives a wider view of how the market is doing, unlike the day trade that is concentrative.
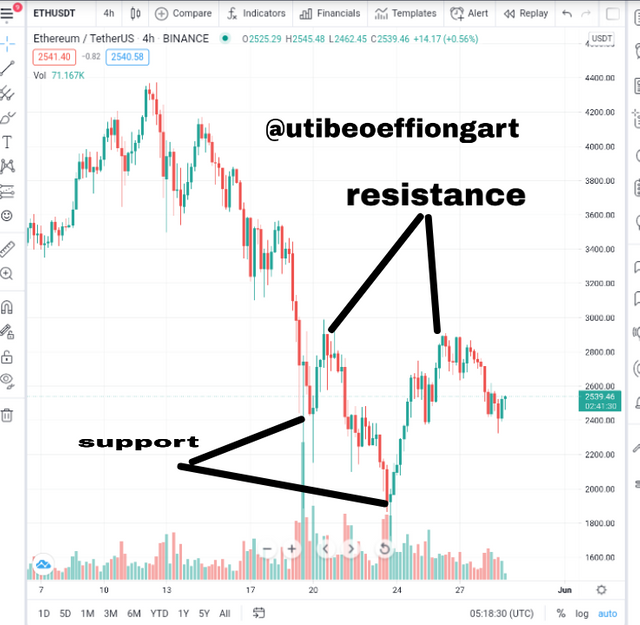
4 HOURS TRADE
Now the above trend of 4hours will help check the support, resistance, oversold and overbought so to enter and exit the trade.
Candlestick analysis and use of other relevant supporting indicators for your trade decision.
Candlestick analysis
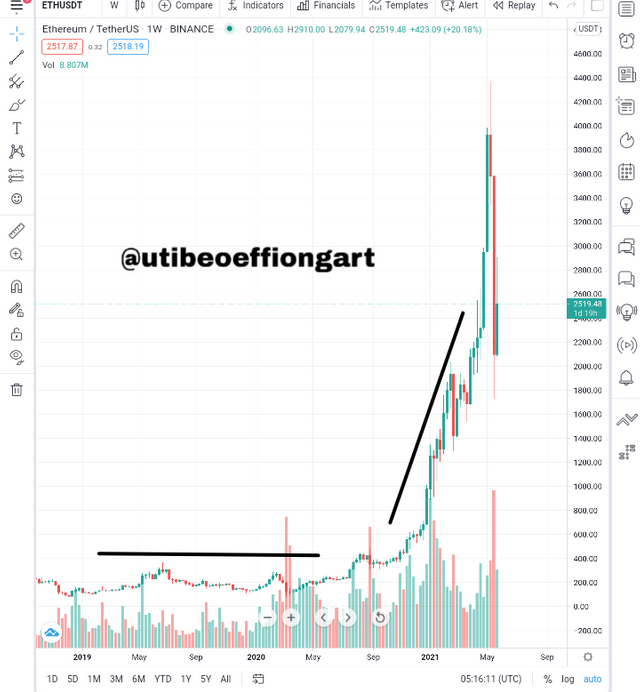
- Above is a weekly trade pattern of the Ethereum USDT pair. Looking at this chart I moved as far back and as 2019 to observe the chart pattern. Notice the market followed a regular pattern for a very long period of time.. from 2019 to 2020 without any significant rise, till September 2021 were it started an uptrend movement. So it took up from 200usdt up till 4000usdt around May 2021 and immediately took a downtrend from that resistance point.
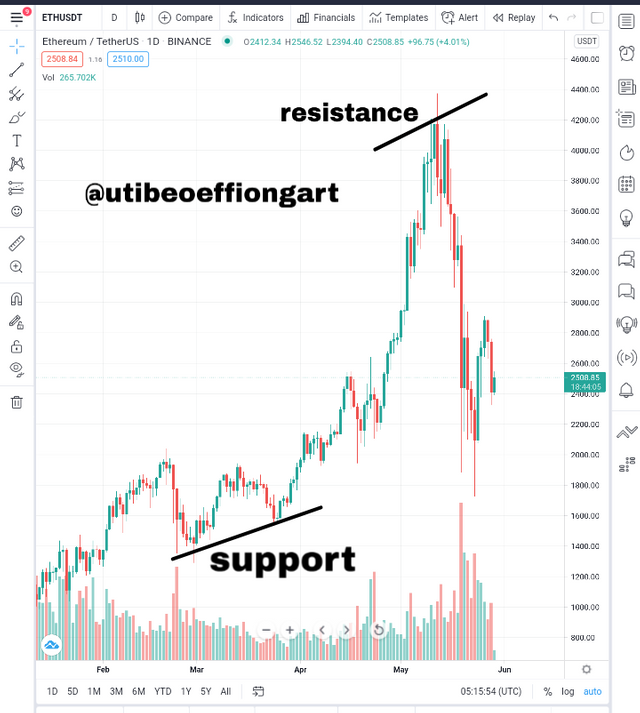
Now analysing for a day. It shows a more clearer view of the trade pattern, were we can spot our daily trade support and resistance. From March to April, the trade broke out of a resistance and then followed a downtrend till March were is entered a support level and followed a the same pattern at April. But form April there was significant bull to a resistant point of 4200usdt.
Now this is were I'll enter my trade, after analysing the trade for the daily and weekly trend pattern, now I have had a good knowledge of the market. And this will help me maximize profit. This is the basic concept of the swing trade.
Now looking at the chart, as at 20 and 24 of May, 2021, there we experienced a support of our candlesticks and this was not even a long lasting one, because it broke out just as it entered, repeated the same pattern for the next day moving towards 27th to resistance point. Now I will set my Stop loss at lower points. Here I set my Stop loss at the last highest low around the 24th of May just before it too on a bull pull. At that point of 1900 just some USDT above 1800.
Use of other indicators.
RSI (Relative Strength Index)
Now just looking at the candle stick analysis we have carried out, it is insufficient to carry out a trade, because you could just be on a wrong pattern, so we need some correction tools to not to make some trade mistakes.
Now we will be carrying out an RSI analysis on our 4hours trade.
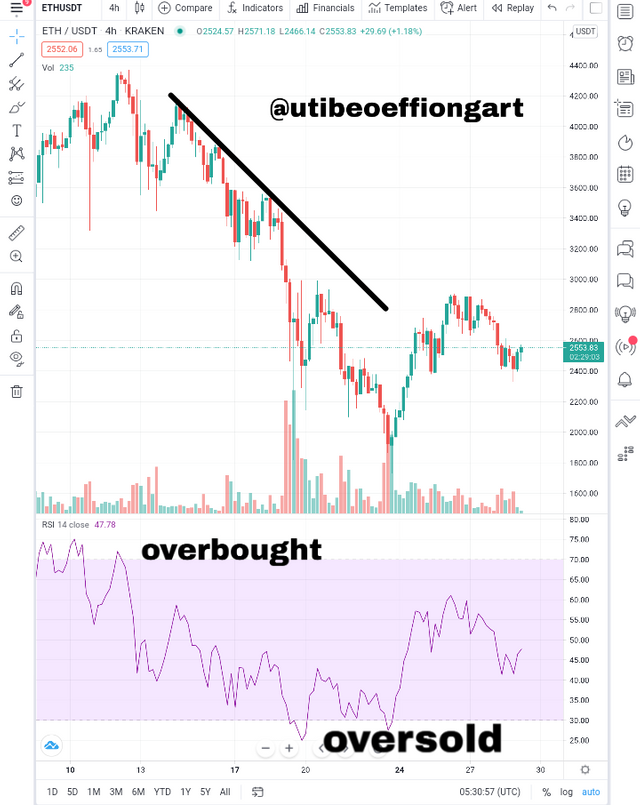
Now looking at the chart above first correction I just observed is that the dip on the 20th of May was even Dipper on the RSI getting deeply into the oversold, since we did not set our stop loss at that point then am covered. Looking at the 24th of May the support level was the same so the stop loss point is okay. Currently the market price is at 2553.8usdt here I will advice a trader or I'll hodl coz the trend is not always stable. I won't buy or sale at this point, looking at the former support level I had already. So I hodl.
MACD
MACD - Moving Average Divergence/Convergence
Now looking at the false signal at the first 4 hours trade which was corrected by the RSI I don't trust the RSI either so I'll try to get to find out more by using MACD to avoid false signal by the chart.
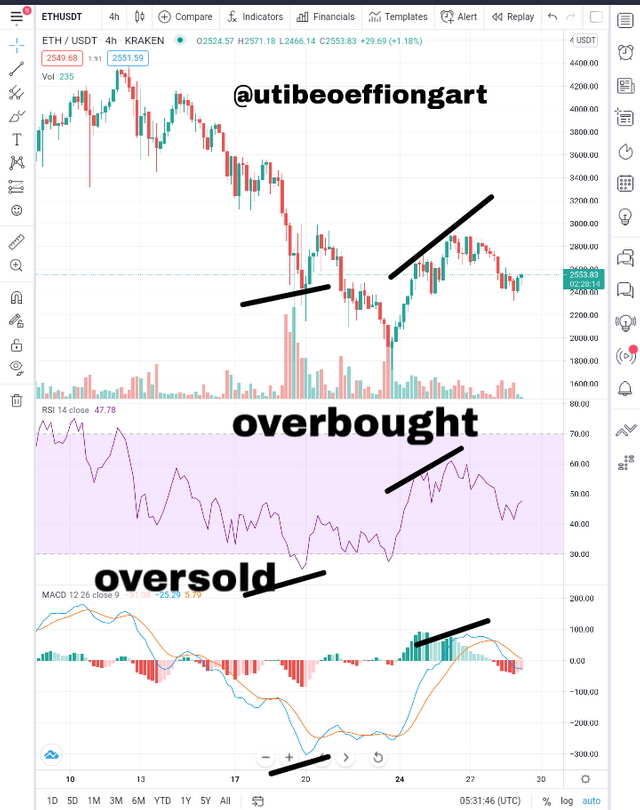
Now looking at the MACD chat the intensity of support on the 24th of May is not the same on the MACD, it looks a bit flat on the MACD. Now if am not convinced enough I can decide to cancel the trade and set a new stop loss.
But currently it is advisable to hodl your Ethureum while expecting a bear trend.
Trade management ( Setting stop loss, trailing stop and take profit)
Before proceeding to investing in Cryptocurency it is important to note that you can't always get it right, so time to time adjustment is needed.
So for this trade I'll set my;
My stop loss = 1900usdt
Take profit = 2900usdt
Trailing stop loss = 1600usdt.
Conclusion
Swing Trading is very useful and concentrative. It give me a bigger view of the market so I can take advantage of the available profits.
Hi @utibeoffiongart
Thanks for participating in the Steemit Crypto Academy
Feedback
This is generally acceptable content. You had no clear trading plan. Your article lacked more details in regards to the use of technical analysis.
Homework task
5