Steemit Crypto Academy Season 4 Week 2 - Beginner's Course | Technical Indicators.


1 a) In your own words, explain Technical indicators and why it is a good technical analysis tool.
b) Are technical indicators good for cryptocurrency analysis? Explain your answer.
c) Illustrate how to add indicators on the chart and also how to configure them. (Screenshot needed).
2a) Explain the different categories of Technical indicators and give an example of each category. Also, show the indicators used as an example on your chart. (Screenshot needed).
b) Briefly explain the reason why indicators are not advisable to be used as a standalone tool for technical analysis.
c) Explain how an investor can increase the success rate of a technical indicator signal.
1a)In your own words,explain technical indicators and why is it a good technical analysis tool.
In the crypto world,there is an important strategy use to gain more insight on price trend and price movement that strategy is always adopted by the so call technical trader or technical analysts,this strategy is called the technical indicator.
Technical indicator are part of technical analysis tool which are graphically represented or plotted as chart, with the purpose of forecasting or predicting the next market or price movement.
The aim of this technical indicator is to indicate the price movement in other words,it helps the technical trader/analyst to know where the price is going and when the price is overvalued owning to buying in an unjustified high price and when it is sold at a price below it value
It uses mathematical calculation that focus on the historical data such as price,volume and open interest,lastly it is often use by technical trader in historical asset price data to judge open and close point for trades.
why is it a good techinical analysis tool
It saves as a good technical analysis tool in many ways but below are the few ways..
Prediction:-like i said before on my explanation of technical indicator,the main aim of technical indicators is to help traders/investors forecast or predict the future price movement.
Alert:-it gives signal to the trader/investors when the price is in an overbought and oversold condition.that is to say it signify when the price is overvalue and when it is sold below it value.
Comfirmation:-lastly it also works as comfirmation tool in the sense that it is use to test other technical analysis tool that how you can check it reliability.
1b)Are technical indicators good for cryptocurrency analysis? Explain your answer.
In my own understanding i think technical indicator is very good for cryptocurrency analysis because it play an important role when it comes to cryptocurrency trading.
when talking about the strategy for better trading in cryptocurrency you can't omit the technical indicator cause of it ability to give investors insight on the past price movement when analysing cryptocurrency trade by such, it will help them predict the future price movement of cryptocurrency using the indicator and also helps to understand the market conditions.
It also give a signal to when cryptocurrency is bought and sold and indicate trend and pattern in the cryptocurrency market.
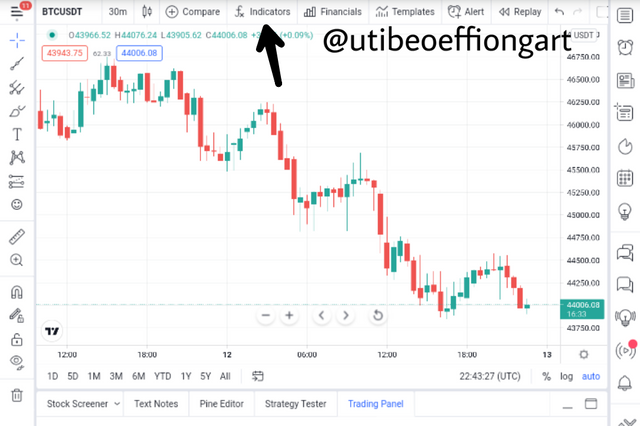
1c)Illustrate how to add indicators on the chart and also how to configure them. (Screenshot needed).
Adding Indicators in a chart
After hitting the chart section in the TradingView platform, choose the Indicator button as seen below.
After that choose the Indicator if your choice, here I choosed the Average directional Index ADX with it accompanying +DI and -DI Indicator lines following suit making the lines three
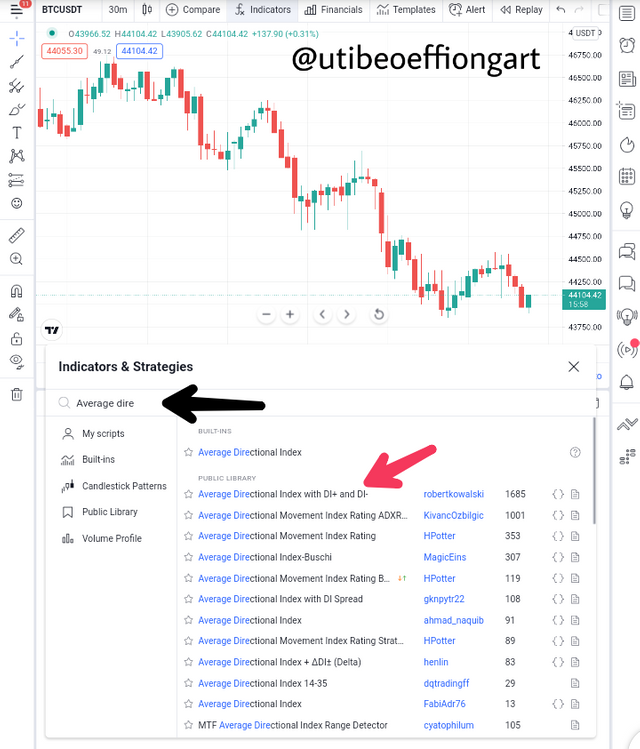
By clicking on the Choice Indicator it automatically applies on the chart as seen below.
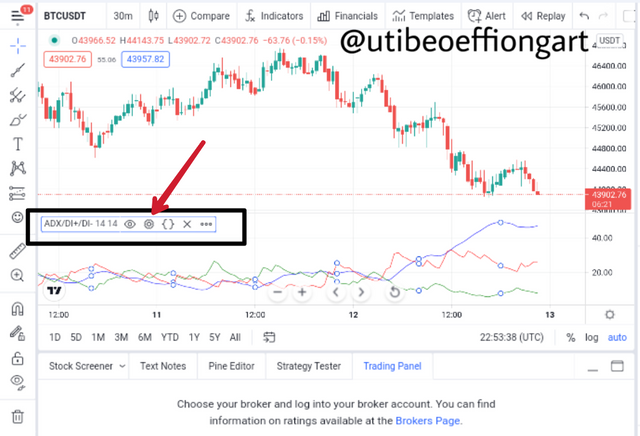
Next is to set the Indicator by clicking on the setting button as seen above. Ave the call out page will come up as shown below.
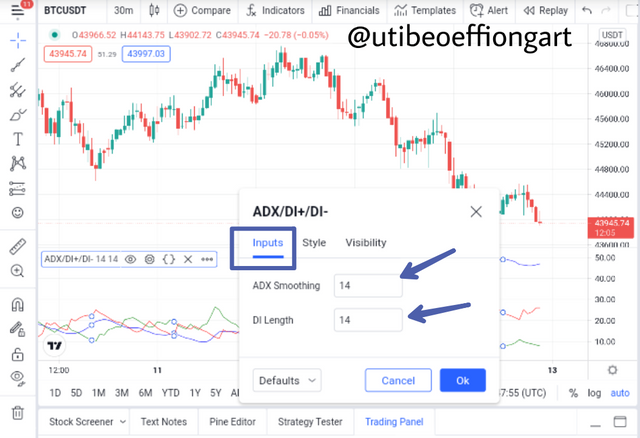
First Setting is the input, this has to do with the length or period of the ADX line
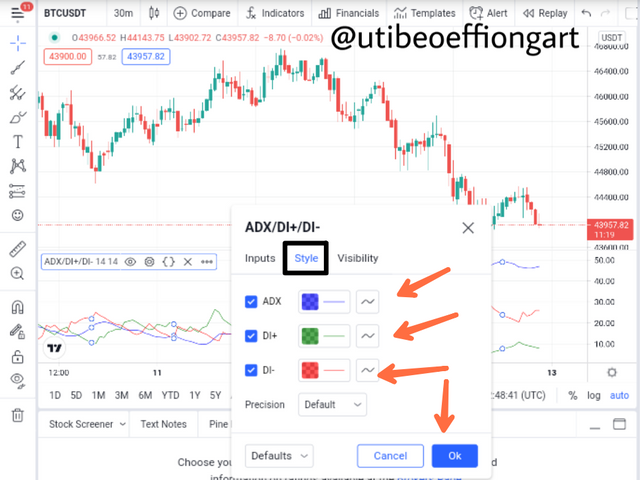
Next has to do with the style of the Indicator, this is always based on what color the trader is convenient with abd can easily identify.
2a) Explain the different categories of Technical indicators and give an example of each category. Also, show the indicators used as an example on your chart. (Screenshot needed).
Technical indicators are categorized into three different categories which are
- Trend-base indicator
- volatility-base indicator
- momentum-base indicator
Trend-base indicator:- This category of indicator is very important to the technical trader cause it show the direction the market is moving to or if there is a trend at all.It also shows the strength of the trend if it is weak or strong to give the investors a better chance of making good trading decisions.
The are sometimes call the oscillator cause the move between high and low level like wave.
Examples of the trend-base indicator are
- Ichimoke kinko hyo
- Average directional index
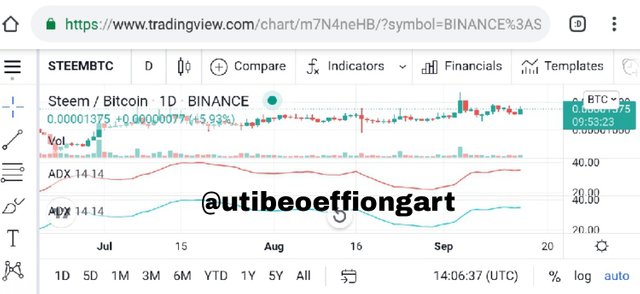
ADI indicator:STEEMBTC
Volatility-base indicator:-unlike the trend-base indicator, volatility-base indicator has nothing to do with direction,all he does is simple just to signify the range of a price of an asset.
Volatility-base indicator is use to measure market swings that is to say it measures how the price is falling and rising in a particular period of time. It give investors the ability to make money cause the price has to move for them to make profit, in that case it help them in a way that the can buy asset when the price is low and sell it when it rise to make profit.
Examples of a volatility-base indicator are
- Average True Range(ATR)
- bollinger Bands
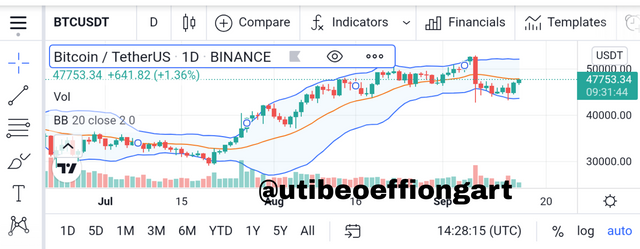
BB indicator:BTCUSDT
Momentum-base indicator:-momentum-base indicator can also be known as an oscillators.
This momentum-base indicator indicate when the price of an asset is moving upward and downward and how strong and week is the stock price it can also be use to analyze the speed of a fall and rise of a particular stock.
This indicator show how far the price of asset has gone and how strong and weak the trend is.
It always determine if the asset is overbought or oversold in the market by this, investors can make profit by selling in an overbought region or the can buy at an oversold region with the aim of increasing it value in future.
Example of momentum-base indicators are
- Relative strength index
- Stochastic
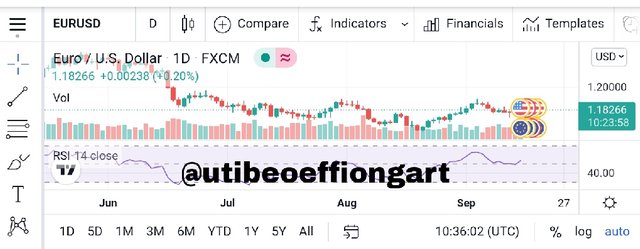
RSI indicator:EURUSD
b)Briefly explain the reason why indicators are not advisable to be used as a standalone tool for technical analysis.
Using indicator as standalone tool for technical analysis is not advisable cause it is highly unreliable,the might give wrong result,false signal and lag behind the current market price most times due to a very weak coefficient of determination so because of this it adviceable to use when couple with other technical analysis indicator.
C)Explain how an investor can increase the success rate of a technical indicator signal.
First of all an investor should have a fore knowledge and understanding of the principle of an indicator there are using and also understand it configuration before using them as technical analysing tool. So for this reason i will recommend a backtesting or use of paper trading(simulated trading) to study and have a better understanding of how indicators are correctly use.
Once again thanks prof.@reminiscence01 for the well explanatory and clarity on your lecture post.Really,It was a nice time going through your assignment.
Hello @utibeoeffiongart, I’m glad you participated in the 2nd week Season 4 of the Beginner’s class at the Steemit Crypto Academy. Your grades in this task are as follows:
Recommendation / Feedback:
Thank you for participating in this homework task.
Hello professors. @reminiscence01. My post is 6 days already and have not gotten an upvote.