Starting Crypto Trading - Crypto Academy / S6W1 - Homework post for pelon53.

image created by me on picsart
As usual I will be expressing my understanding of this lesson through the task questions.

In your own words, what is fundamental analysis? Do you think it is important for a trader? Justify the answer.
Cryptocurrency which we know is highly volatile so investing on them especially the new tokens needs a lot of research and evaluation of all available information, that were the fundamental analysis comes in.
Fundamental analysis as the name implies is a strategy were traders uses in studying a particular cypto asset. This strategy detect the authentic and objectives values of cryptocurrencies not minding the market price. As we all know that having a knowledge about a cryptocurrency value makes a traders understand if an asset is undervalued or vice versa or if it a good investment asset or not.
Fundamental analysis simples means taking a deep dive or making a deep research into an available information or factors that influence the cryptocurrency. For example, taking a research about the token use case, the number of people dealing with the coin, it past price movement and the project team of the coin, with main reason to know whether the particular currency is overvalued or undervalued at that period. With this information a trader can be able to detect if to take an investment decision.
Fundamental analysis is important to a trader in terms of playing an important role in trading and investment decisions of the trader.
When a trader conduct a fundamental analysis and arrived at an asset intrinsic value, it will serve as a bench mark to determine whether the asset is undervalued or overvalued. For example, you can buy an asset when it undervalued by the market and sell it when the price goes high this can pave way for a profitable investment. so it serve as a way to know when to buy,sell and hold the token in other to make profit.
The main goal of this fundamental analysis is to reduce trader and investment risk and spur the profit potential of an asset.
Explain what you understand by technical analysis and show the differences with fundamental analysis.
In terms of making profit in the cryptocurrency market, technical analysis is very important to the point that many traders can do without it.
Technical analysis are financial analysis that uses pattern in the market data to identify and make predictions or forecast the movement direction of price through the study of previous market data and price volume. In other words, it a kind of trading strategy were traders engaged to evaluate investment and spot out trading opportunity by using the concept of statistical trends taken from past trading activity( price movement and volume) to predict future market price.
Technical analysis uses past market chart(price,times volume and width) pattern and trend to predict the price movement of future asset.
Unlike the fundamental analysis it is commonly use to know the right time to venture into the market.
| Technical analysis. | fundamental analysis |
|---|---|
| Technical analysis is a strategy where price are evaluated and forecasted base on the basic of price movement and volume of transactions. | fundamental analysis is a strategy where traders engage on research about a particular asset so as to know it intrinsic value for a long term investment opportunity. |
| Technical analysis strategy are engage mostly for short term investment only. | fundamental analysis are used by trader who wish to invest in an asset in a long term, which is likely to rise in future in other to be profitable. |
| Technical analysis is used to identify the right time to enter position in the market either exits or entry position. | Fundamental analysis aim is to get a true value of an asset. |
In a demo account, execute a sell order in the cryptocurrency market, placing the support and resistance lines in time frames of 1 hour and 30 minutes. Screenshots are required.
As we all know installing resistance and support strategy when taking trade is very important as it is seen as one of the technical analysis tools.
To perform this task, I will be using tradingview, a demo account as requested, then place a sell trade by signifying the support and the resistance line in a 1hour and 30minutes timeframe.
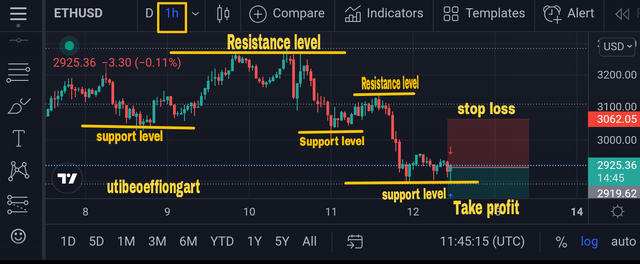
First, I used the 1hour time frame on an ETHUSD chart, then I indicated my resistance and support as seen on the image above, then later place my stop loss and take profit which I executed my trade.
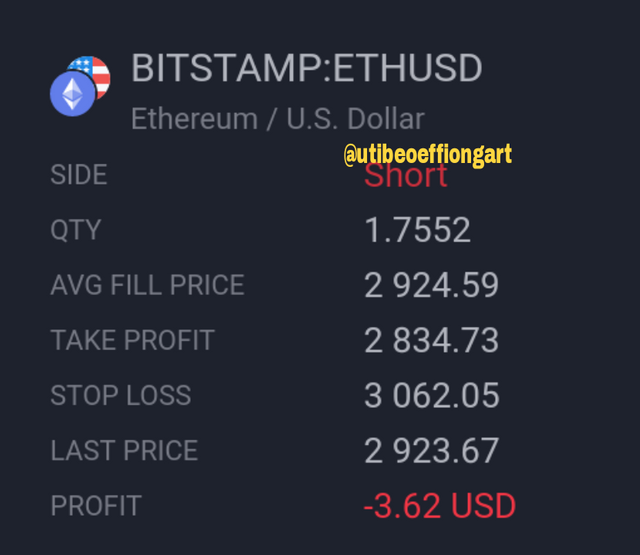
Trade result.
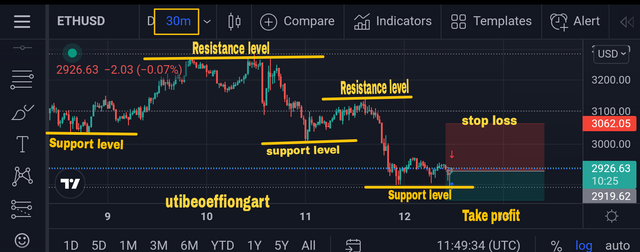
I then reduce the 1hr time frame to a 30minute time frame on the same previous chart(ETHUSD) I used for the 1hr timeframe. I indicated my resistance and support on the 30min timeframe, I set my stop loss and take profit then execute my trade.
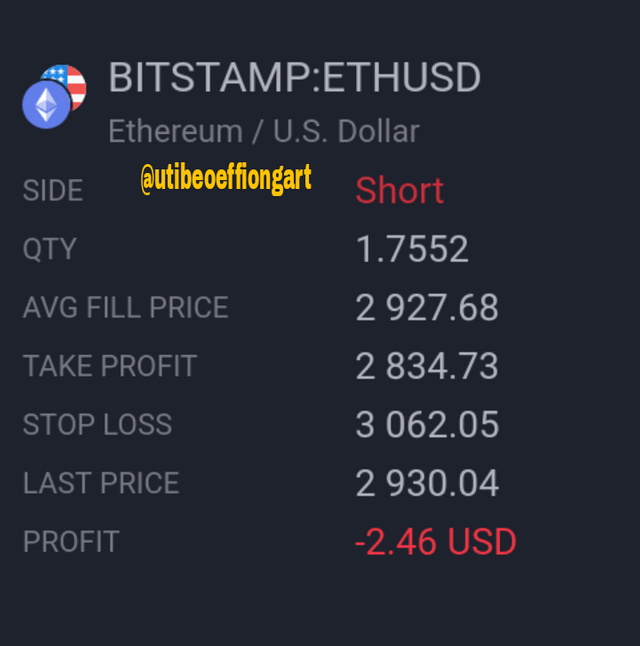
My trade result.
Looking closely at the chart, the resistance level and the support level drawn in the 1hr timeframe and 30 min timeframe didn't change much, as seen on the image if compared, but the previous support level was already changing to the resistance.
This means that when support breaks from an high timeframe to a lower time frame it tends to become a resistance level.
In a demo account, execute a buy order in the cryptocurrency market, placing the support and resistance lines in time frames of 1 day and 4 hours.
As we all know installing resistance and support strategy when taking trade is very important as it is seen as one of the technical analysis tools.
To perform this task, I will be using tradingview, a demo account as requested, then place a buy trade by signifying the support and the resistance line in a day and 4hr timeframe
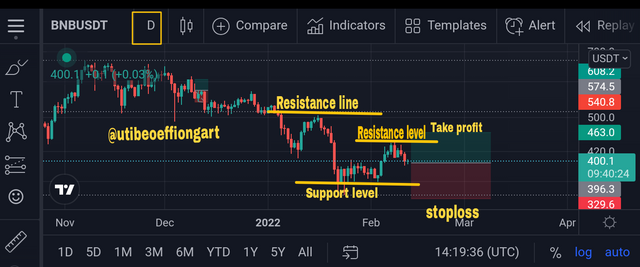
Firstly, I used a day time frame on an BNB chart, then I indicated my resistance and support as seen on the image above, then later place my stop loss and take profit which I executed my
buy trade.
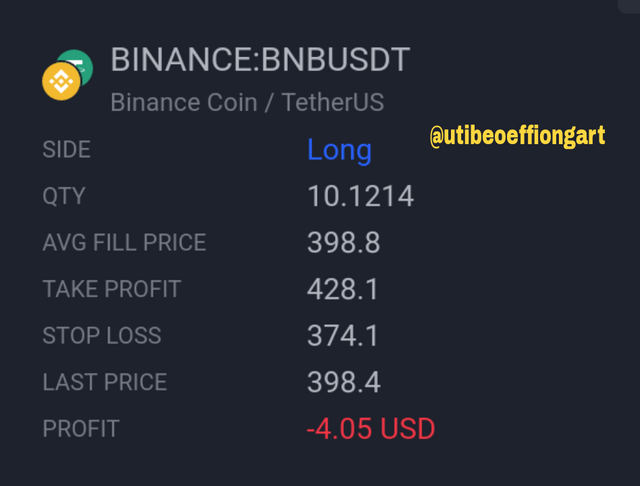
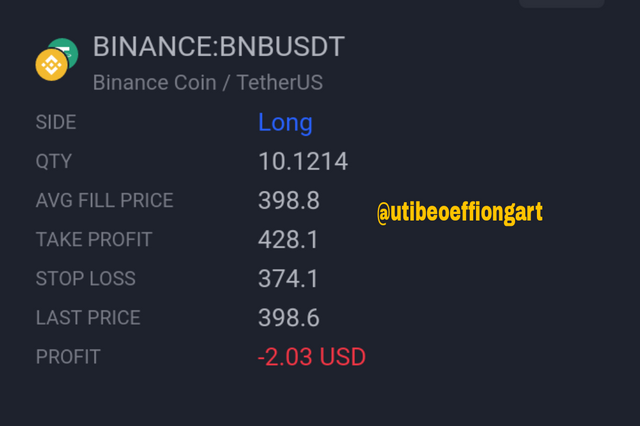
Result of trade.
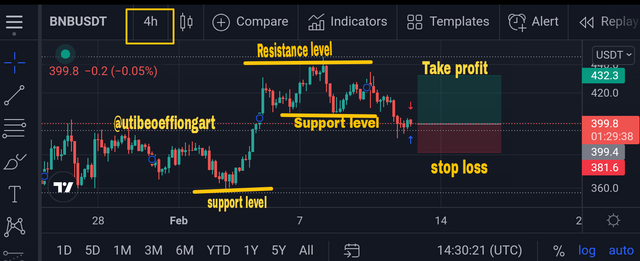
I then reduce a day time frame to 4hr time frame on the same previous chart(BNBUSDT) I used for a day timeframe. I indicated my resistance and support on the 4hr time frame, I set my stop loss and take profit then execute my trade.
Looking closely at the chart, resistance level and the support level drawn in the day timeframe and 4hrs min timeframe didn't change much, as on the image if compared but the previous support level was already changing to the resistance.
This means that when support breaks from an high timeframe to a lower time frame it tends to become a resistance level.
Explain the “Hanging Man” and “Shooting Star” candlestick patterns. Show both candlestick patterns on a cryptocurrency market chart. Screenshot is required.
Hanging man candlestick is a single candlestick pattern found in an uptrend of an asset price chat which represent a potential bearish reversal. As I said previously it is always form at the high end of an uptrend asset.
Hanging man is always identify by it long lower wick and has a short body at the top of a candle stick with less or no upper wick.
It can be easily identify through it characteristics listed below.
It is always found in an uptrend price movement(bullish movement).
It always has a long lower wick
It always has less or no upper wick
It has a small body in which opening price,closing price are always close to each other.
All this implies to the chart below
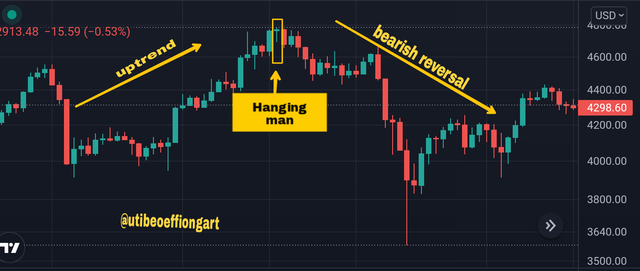
In other for this hanging price to be valid, traders believe that the lower wick must be atleast two times greater than the size of the body of the candle and it candle must be found at the upper end of the trading range.
The hanging man serve as Warning for traders that they might be a potential market reversal as the bull are gradually losing to the bear.
Shooting star candle stick pattern is somewhat the opposite of a hanging man candle stick pattern. Unlike the hanging man, It is always bearish candlestick pattern which has a long upper wick or shadow.
Shooting star candlestick pattern is always formed after the formation of the hanging man candlestick pattern situated at the high end after an uptrend of an asset. It is made up of candlestick with a small lower body and a little or no lower wick and it has a long upper wick which is two time the size of the lower body.
It can be easily identify through it characteristics listed below.
It is always found in an uptrend price movement(bullish movement).
It always has a long upper wick
It always has less or no lower wick
It has a small body in which opening price,closing price are always close to each other.
All this implies to the chart below.
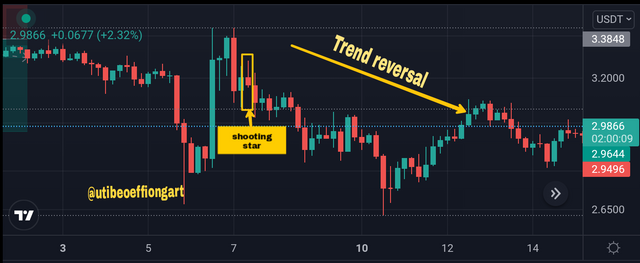
The shooting candle pattern interpret situation where buyers spurs up the price to a certain point during the period where the candle was form, but later experience a selling pressure which brought the price down for the period to close near the open, this selling pressure serves as a sign for a potential trend reversal.
Fundamental analysis and technical are two important aspect a good trader must not avoid if he/she tends to succeed in trading.
Fundamental analysis simples means taking a deep dive or making a deep research into an available information or factors that influence a token in other to investment with it. On the other hand a Technical analysis is
a financial analysis that uses pattern in the market data to identify and make predictions or forecast the movement direction of price through the study of previous market data and price volume.
Thank you prof. @pelon53 for an educative lectures you put up, through you lecture have been able to expand my knowledge on fundamental and technical analysis were I was able to define with my own understanding and state it importance and differences. I was able to apply resistance and support in my chart execution and also define the concept of hanging and shooting star all this was possible through you lecture.
Once again thanks prof.@pelon53 for you lecture looking forward to your next lectures.
