Recognizing simple pattern in trading - Crypto Academy / S5W2 - Homework Post for @sachin08

Now to the lectures in proper
- What is your understanding about Triangles in Trading. Explain all forms of triangles in your own words. (Screenshot required)
In trading, triangles are technical analysis tool or strategy that traders use in spotting trend and also predicting future market outcomes in the crypto market, so as to aid trading success and help them make profit.
This triangle are continuation pattern that are form on the chart with a triangular shape because of the activities of traders in the market. That is to say, the formation depends on the buying and selling activities in the market. There are mostly use by traders to spot the continuation of bullish or bearish market and also market reversal.
This triangles are of three types, there are :-
- Ascending triangle
- Decending triangle
- Symmentrical triangle
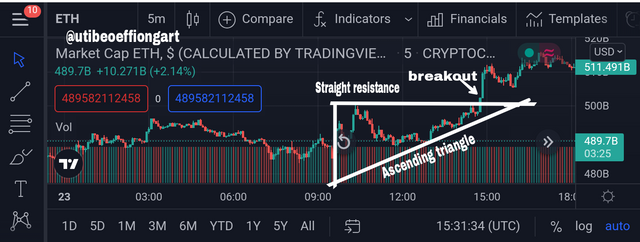
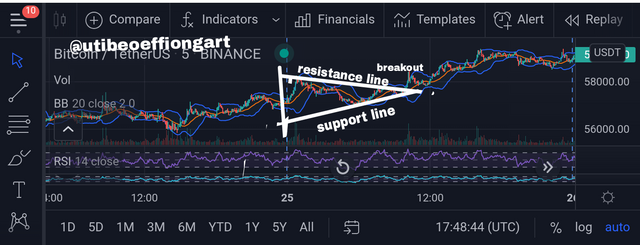
Ascending triangle is a signal that indicate that asset price is likely to rise higher as the pattern complete it formation that why it is always regarded as the bullish.
This ascending triangle always involve two trendline coming together at the edge. The first trendline is always flat along the top of the triangle, which there always act as a resistance. When the price successfully break pass it(resistance), the will indicate that the market will begin an uptrend.
Unlike the first trendline, the second trendline is always along the button line, there always act as the support.
Lastly, the ascending angle are form when asset price bounce back and front in between the line.
Below is the chart showing the ascending triangle
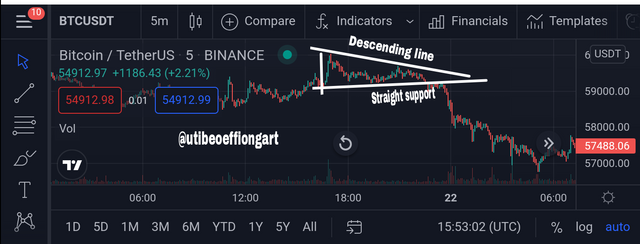
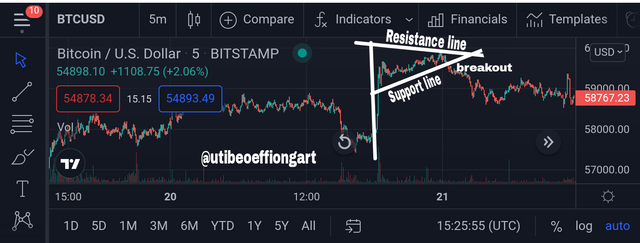
Descending triangle is somewhat opposite to the ascending triangle.
The Descending triangle is a signal that indicate that an asset price is likely to continue going lower as the pattern complete it formation, that why it is always regarded as a bearish signal.
Descending triangle involve two trendline coming together to form the pattern, unlike the ascending triangle, in the descending pattern the support button line is always flat while the top resistance line normally descend or move downward forming a downward trend.
Lastly, the descending angle forms when an asset price and rise by bouncing off the support line.
Below is the chart showning the decending triangle.
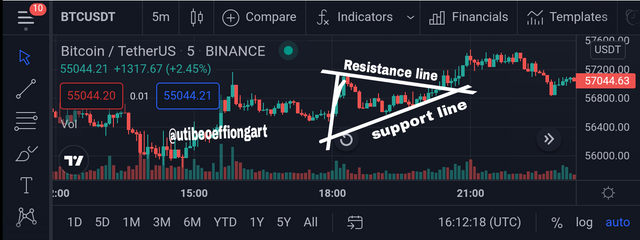
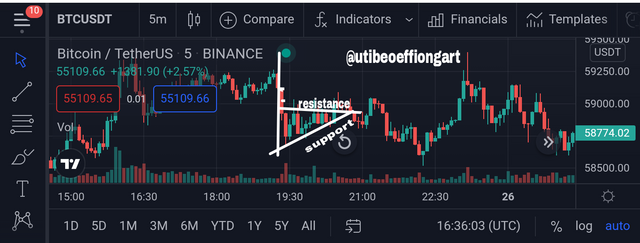
Symmetrical triangle is a pattern which traders use to forecast if an existing trend is likely to continue or the will be a possible trend reversal.
This pattern is forms as an ascending support line and descending line join together when an asset price is ranging.
In symmetrical triangle, the breakout can be in bullish or bearish and asset price normally bounce back and forth in between two trendline.
Below is the chart showing the symmetrical triangle..
2).Can we also use some Indicators along with it Triangle Patterns? Explain with Screenshots.
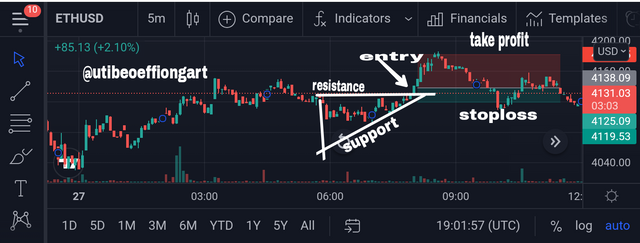
Yes!! We can, using an indicator along with the triangle pattern is a better trading choice, cause it's gives accurate signal and interpretation to a market. There are (indicator) most importantly use by traders for confirmation of signal towards the formation of triangle pattern and help differentiate a true triangle pattern from other chart pattern.
Finally,it aid the pattern reliability in trading when combined with indicators.
Though it is sometimes adviceable to Combine the triangle pattern with a moving average indicator and a momentum indicator in the case of using two indicators in a chart, it is always considered the best way to make a more accurate and reliable interpretation in the price chart that is trading.
But here in my chart I used a two mometum indicator, the bolling bands indicator and the relative strength index indicator along with a triangle pattern, looking closely on the chart below we can see how the both indicators(bollingband and RSI ) comfirmed the buy signal, which mean at this point it signals a go ahead to the buyers to make a buy entry.
3). Explain Flags in Trading in your own words and provide screenshots of both Bull Flag and Bear Flag.
Traders use flag to identify a continuation of a past trend from a point at which price is moving in a direction against the same trend,it normally signifys trend reversal or breakout after the period where there is no trend in the trading range and also, it is use as the entry point for past trend to continue.
The flag is always formed when a trending asset price suddenly stop trending and go back over the same route in flag shape.
A bull flag forms on the chart when an asset price is in a strong uptrend(bullish trend).
Looking at the chart below you can see the pattern looking like a flag on a pole, it is always considered a bullish flag since the flag appear in an upward direction.
Traders makes trade with the bull flag considering the two line connected to the triangle, which are there resistance and the support level.
Here when the price break through the resistance level it adviceable to place a buying trade and likewise,when the price break through the support level it adviceable to place a buying trade.
Below is a chart showing a bull flag.
Bear flag is somewhat opposite to the bull flag.
It forms when an asset price is in a strong downtrend(bearish).
Looking at the chart below you can see that the pattern looks like a flag on a pole facing a downward direction, it is always consider a bearish flag since the flag appear on the downtrend.
Like the bull, considering the resistance and the support, when the price break through the resistance level it adviceable to place a buying trade and likewise,when the price break through the support level it adviceable to place a buying trade.
Below is a chart showing a bear flag.
4).Show a full trade setup using these Patterns on any Cryptocurrency chart. (Ascending Triangle, Symmetrical Triangle, Bear Flag)
Ascending Triangle
To setup a trade using ascending triangle
- Firstly, identify an uptrend
- Apply the measuring strategy when the triangle is form, then anticipate a breakout.
- After a strong break above resistance, enter a long position or buy entry, then setup a stoploss at the swing low and also setup a take profit target in the line.
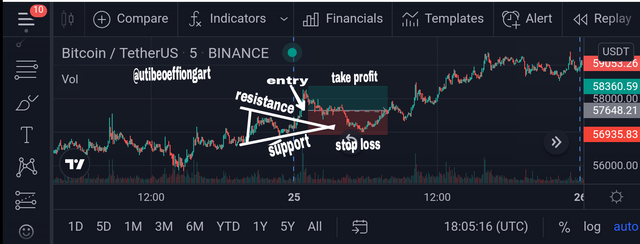
Symmetrical Triangle
To set a trade using a symmetrical Triangle
- Identify a symmetrical triangle
- Apply a measuring strategy when the triangle is form, then anticipate a breakout in the case of buy setup.
- After a strong break above the resistance, enter a long position, then setup a stop loss at the swing low and setup a take profit target.
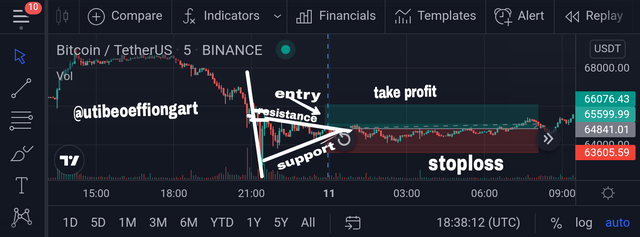
Bear flag
How to setup a trade using a bear flag
- Identify a downtrend(flagpole)
- And also identify upward slope range(bearflag)
- Enter trade from the breakout below the lower channel,then anticipate a breakout.
- Set stop loss at the top of the chart and setup a take profit. Finally, the trade will execute when price reaches the take profit.
Recognizing chat pattern is very important when it comes to trading as a whole, cause of his ability to help traders to gain an advantage in to the market. This pattern are mostly use to predetermined price action were it is form through the movement of asset price on chart giving trader a good precise way of entering into the market.
Pattern like triangle pattern have been mostly use by traders in recent days in spotting trend which help them predict future market outcome. This pattern comes in different types which is important for a trader to understand them in order to place a successful trade.
Once again thank you prof. @sachin08 for the well explanatory lecture, going through your lectures was fun. Really have learnt alot.