Technical Indicators 2 - Crypto Academy / S4W4- Homework Post for @reminiscence01
1-a) Explain Leading and Lagging indicators in detail. Also, give examples of each of them.
Leading Indicator is a technical analysis tool which helps to understand the future market direction and price prior to starting of market movements.
The person who gets use for this indicator will get the benefits as follows;
- Less time consuming for trades because this indicator will let us know correctly of the time that we have to be present for trading in the market.
- Losses can be stopped / reduced while the profits can be increased simultaneously.
For an example, Steem price analysis of the last 2/ 3 months would give us a clear idea about this fact.
If you were in touch with the Steem market, in the last few months Steem price touched a value around 0.2$ and at that time it was named as that Steem coins were in the oversold range. At that time the leading indicator will definitely would have indicated a market trend reversal in the near future as to what we are experiencing today. Because nowadays Steem price moves up to 0.6$ where it shows nearly 3 times higher than to the value of what it was there before 3 months.
As everything has got two sides; in a strong oversold or an overbought market, the given results with the use of a leading indicator might lead to false signals. This may cause the traders to leave the market or gets confused and in turn try to get into a next move.
Stochastic Oscillator, KDJ, Average Dirctional Index, RSI, Donchain Channels, , Rate of Change (ROC), Commodity Channel Index (CCI)are some of the examples for leading indicators.
With the use of this indicator, after starting the movements in the market, the traders will get to know about the future movements. In a nutshell, the signals will be given very lately.
The person who uses this indicator will have to get an experience with;
- Missing of the most important moves in the market
- High losses and less profits.
Expertise suggest that, this indicator will be very suitable for trading which may take a long period.
Moving Average Convergence Divergence (MACD), Moving Averages (MA), Parabolic Sar, Bollinger Bands, Exponential Moving Average are some of the examples for lagging indicators.
1-b) With relevant screenshots from your chart, give a technical explanation of the market reaction on any of the examples given in question 1a. Do this for both leading and lagging indicators.
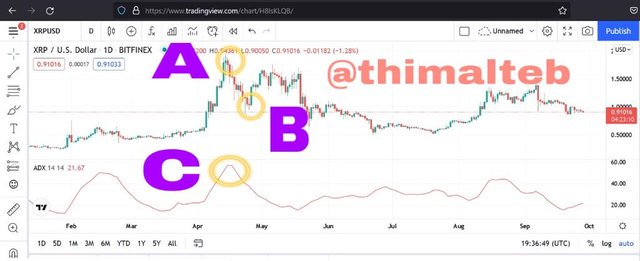
For this example I got the XRP/USD pair for the purpose of analyzing. According to the point “c” the indicator gives an overbought signal and soon after the Indicator shows the sell signal, the price chart stated to move from point “A” to point “B” which is known as a bearish move or a trend reversal to the opposite direction.
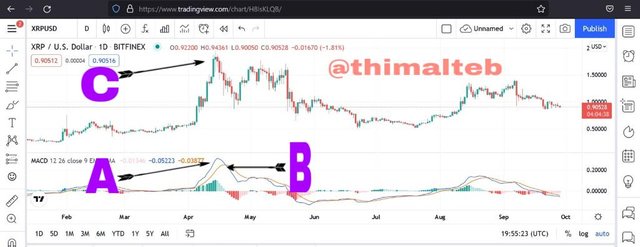
Originally the trend reversal has happened at the point "C". But as you can see, at the time of the MACD indicator gives the overbought signal (Point B), the price market has already begun the bearish movement. Initially, if the indicator wasn't lagging the indicator will give the overbought signal somewhere around the point A. When comparing the Point "A" and point "B" clearly we could see that, there is a lag in the MACD indicator which gives the indicator signals later than what the trader was expecting.
2-a) What are the factors to consider when using an indicator?
Get a good understand of your trading style.
It is so important not to misuse indicators or do not keep trying on in every single indicator. Just understand the basics correctly. Trying on every indicator may lead you to give false signals as well. Before selecting an indicator, first you should somehow try to understand the market and your trading strategy. In a nutshell, know your capabilities of analyzing. Then the expected true signals can be achieved easily.
Learn and get know about market behaviors which are trending or ranging.
Market can be up-trended, down trended or ranging. So it is so important to figure out these points and thereafter select the best suitable indicator with reference to the market movements. We can use MA, ADX, Parabolic SAR indictors to analyses a trending market.
For ranging markets, momentum or volatility based indicators may give us the opportunity to get the idea of the behaviors of the overbought and oversold ranges. We can use RSI, MACD, ATR, Bollinger Bands indicators to analyze the ranging markets.
Get to know about which indicator to be used at which point.
Many of the traders nowadays find difficulties in finding the best suitable indicator and finally ends up getting false signals. Every indicator has it own features and the it is a must to get a good knowledge of your indicator which you select according to your trading strategy.
Find confluences.
Every trader will like to get true signals from each and every indicator. So nowadays traders use more than two or more indicators. So if these two or more indicators give the same result, we call it as a confluence. So finding confluence result giving indicators will rise up the accuracy of getting true signals. This will ease up the things for the traders.
2-b) Explain confluence in cryptocurrency trading. Pick a cryptocurrency pair of your choice and analyze the crypto pair using a confluence of any technical indicator and other technical analysis tools. (Screenshot of your chart is required ).
As I mentioned earlier, confluence can be used in indictors and confirm the trade by the same signal giving indicators. Not only the indicators but also we can use confluence in multiple strategies or other trading tools to get an accurate results by knowing the same signal points.
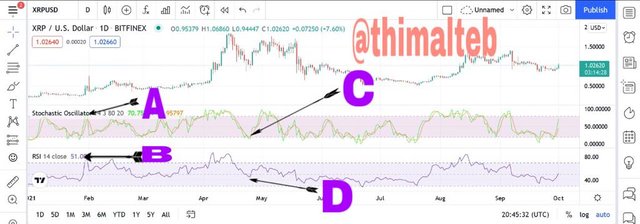
Below is the screenshot of the piece chart between XRP/USD. Stochastic Oscillator and RSI indicator was used as indicators to analyze the price chart. According to the two indicators, at point "A" and point "B" indicators indicated bullish signals where as at "C" and "D" points both indicators signals Bearish signals.
3. ( a) Explain how you can filter false signals from an indicator.
Every trader would like to to get true results from the indicators they've got. But, when he / she analyzing the market, what happens if the market price movement is saying a different thing to what the indicator says. This is where false signal scenario comes into the action.
For an example as in the early stages of this home work post, I've discussed about how the leading indicators will help to sort out the market reversals. According to that when a when a trader is experiencing a overbought or oversold region according to the leading indicators it shows a trend reversal. But when a false signal is forming that doesn’t happen, the indicator signals and the market behaviors will not confluence with each other and they will give results in the opposite direction.
Furthermore, to filter out these false signals, one can use two or more indicators to see the confluences of each other to make a good decision.
3-b) Explain your understanding of divergences and how they can help in making a good trading decision.
As discussed in the previous case ,there are results, which given by the indicators and the market price movements do not tally with each other. This will tend to give false results and this scenario is named as divergence. This divergence is very useful to spot out the false signals in the early stages to know the trend reversals.
There are two type of divergences called as; bullish and bearish. When the market price makes lower low and the indicator gives higher high, we call it a up trend and it is also called as bullish divergence.
When the market price makes higher high and indicator signals lower low, we call it a down trend or a Bearish divergence.
3-c) Using relevant screenshots and an indicator of your choice, explain bullish and bearish divergences on any cryptocurrency pair.
To explain both bearish and bullish divergences I’ll be using the XRP/USD and TRX/USDT price pairs along with the Relative Strength Index (RSI).
Bearish Divergence
Final result of these type of divergences will be a strong downtrend and here the price actions make a higher high on the price chart while at the same stage the indicator shows a lower lower.
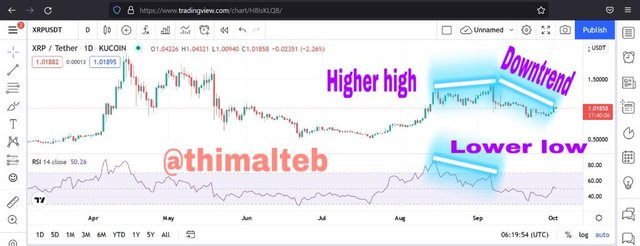
As you can see in the above price chart between XRP/USDT, it shows a higher high movement and the RSI indicator at the same time shows a lower low movement and the price movement ended up in a strong downtrend.
Bullish Divergence
Final result of these types of divergences will be a strong uptrend and here the price chart shows lower low movement and at the same time indicator shows a lower high movement.
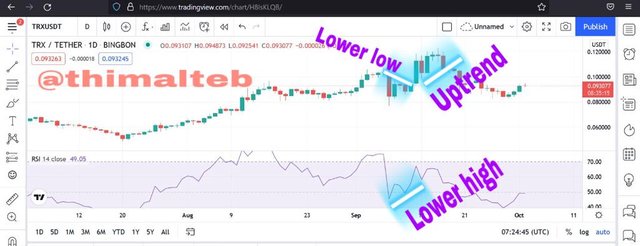
According to the above price chart between TRX/USDT , it shows a lower low movement while the indicator shows a lower high movement and finally the price chart ended up in a strong bullish /uptrend.
This is my homework post for season 4 week 4. Prof.@reminiscence01 thank you very much for giving such an important knowledge regarding the trading theories. Hoping to learn more from you!
Hello @thimalteb , I’m glad you participated in the 4th week Season 4 of the Beginner’s class at the Steemit Crypto Academy. Your grades in this task are as follows:
Observations:
This could have been better if you had carried out a technical analysis here to back up your explanation.
I'm impressed with your submission. You tried to provide a technical explanation on the question and have also used relevant screenshots for illustration.
Thank you for participating in this homework task.
Thank you very much professor for your feedback!!!