Estrategia y uso de los Canales de Donchian - Crypto Academy/S5W1 - Homework post for @lenonmc21 - by @subconsciousness
A BRIEF INTRODUCTION
At the beginning of the first week of the 5th season of Steemit Crypto Academy, I am performing astonishingly in these trainings. This is my 3rd homework this week. It is very nice to learn new things, my knowledge is constantly increasing. Since I will be using Google Translate, I may have some difficulties due to the language, but I hope we will not have too much trouble. Thank you professor @lenonmc21 for this valuable explanation about Strategy and use of Donchian Channels. You can see my homework below.


1.¿Explique y defina con sus propias palabras qué son los Canales de Donchian.?
We should never make any random transactions when investing in cryptocurrencies. By examining the past of the market, predicting its trends and thinking about how it will follow in the future, we should invest accordingly. At this stage, technical analysis tools are very useful to us.
One of these tools, which name I have heard for the first time, is the Donchian Channel. In very simple words, the Donchian Channel is a trend indicator developed by an expert. The Donchian Channel represents an area that plots the highest and lowest prices over a period of time, including the current price. The volatility of the market can also be measured, since it has a structure that expands with the increase in price volatility and contracts with its decrease.
When we add this indicator to our chart that we will examine, it is visually a striped indicator like Bollinger bands, but it keeps the borders more rigid and does not expand as much as in Bollinger. With this indicator, it is also possible to detect when the current trend will return or to determine overbought situations.
Source: TRX/USDT on Gate.io
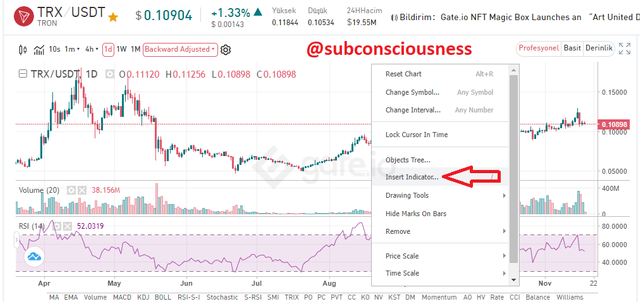
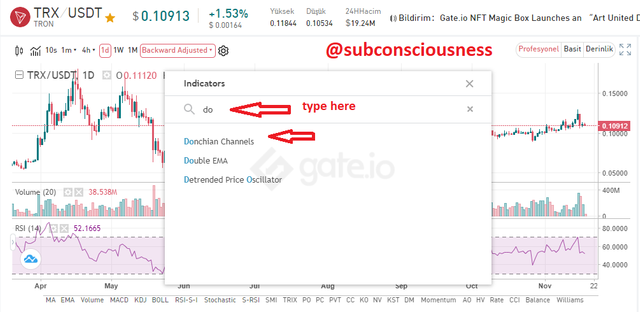
After talking about the Donchian Channel indicator, let's talk about how to add it to the charts. This indicator is already present in all advanced charts. First, we right-click on our graph and call it insert indicator. We write the name of our vehicle, namely Donchian Channel, into the search bar on the indicators screen and the following options appear. When we click on Donchian Channel, this indicator is automatically processed on the graph we are going to analyze.
Source: TRX/USDT on Gate.io
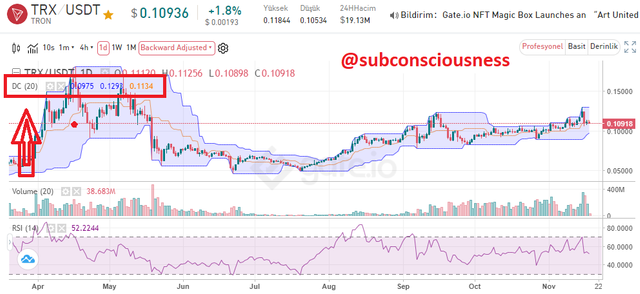
We can now see our channel on our chart. We have a scanned channel between the upper band and the lower band with a blue line and the middle band with an orange line. The indicator we added appears as DC (20) at the top left of the graph. Right next to it, we can see the price values of the upper, lower and middle bands.
Source: Donchian Channel indicator on TRX/USDT on Gate.io
.png)
2.¿Explica con detalle cómo se calculan los Canales de Donchian (sin copiar y pegar de internet)?
Calculations are made about how the Donchian Channels were formed by taking the averages of some specific prices in a certain retrospective period.
Since the channels we will add to the chart are 3, we will make 3 calculations. These channels are Higher Band, Lower Band and Middle Band. We can also call this middle channel Donchian channel.
1.High Band
- A time period is selected.
- The highest highs of each unit in that selected time period are checked...
- Among these values, the highest value is selected.
- In this way, our higher band was prepared.
2.Low Band
- A time period is selected.
- The lowest lows of each unit in that selected time period are checked...
- The lowest value is selected among these values.
- In this way, our lower band was prepared.
3.Middle Band
- A time period is selected.
- In each unit within the selected time period;
- Average calculation is made for highest highs (HH and ) and lowest lows (LL). marks on the graphic.
((HH)+(LL))/2 - In this way, our DC was prepared.
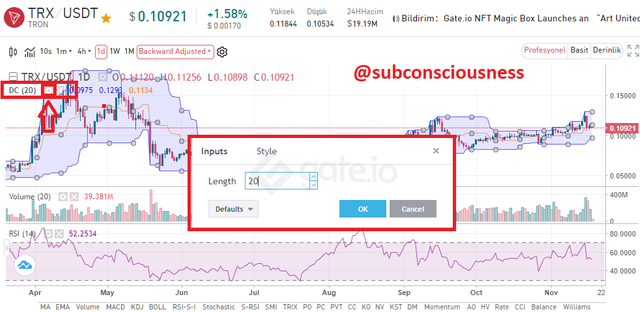
In the first question, when we add the indicator to the chart, the value of 20 shows that by default, the bands are formed by taking the Highest High and Lowest Low values of the last 20 candles. If we want, we can change this value of 20 candles from the indicator settings shown in the picture. In addition to this, we can change the time interval of our chart to be minute, hourly, daily. The point to consider is how many candles in total the HH and LL levels will be monitored.
Source: Donchian Channel indicator settings on TRX/USDT on Gate.io
3.¿Explique los diferentes tipos de usos e interpretaciones de los Canales de Donchian (Con ejemplos de operaciones alcistas y bajistas)?
In the first question, we said that trend analysis and volatility interpretation can be done with donchian Channels. We will make these comments depending on the movements of the candles on the chart of the commodity we will analyze within the indicator. In the second question, we said that we have 3 bands in our Indicator. Our technical analysis is also interpreted differently if our candles on the chart approach the upper band, approach the lower band, approach the middle band or cut the middle band.
Bullish Trend and Overbought Zone
If we are going to examine the different types of usage of the Donchian Channels, let's start with the bull tiaret. If the market price approaches the upper band and even pushes the upper band even higher, it indicates that the bulls dominate. It tells us that there is an uptrend. The fact that the instant price comes to the upper band also indicates that it is in the overbought region. It does not mean that the price will decrease due to excessive purchase. Only the indicator signals. A bullish trend is when the uptrend comes to the overbought zone, then pulls back a little and forces the upper band repeatedly. In this way, it exhibits a stronger rise in bull dominance. Of course, it is necessary to enter the position knowing that all of these are future trends that are predicted according to past movements.
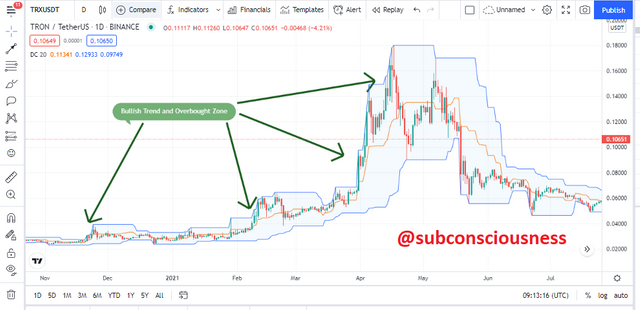 Source: Bullish Trend on TRX/USDT on tradingview
Bearish Trend and Oversell Zone
We can say the following regarding the bear trend and bearish decline in the use of Donchian Channels. If the market price approaches the lower band and even pushes the lower band further down, bears dominate. It tells us that there is a downtrend. The momentary price coming to the lower band also indicates that it is in the oversold region. Just because it's oversold doesn't mean the price will go up. Only according to the psychological and financial decisions of the investors, there may be an increase in the price, or the support may be broken and the price may fall even lower. After the indicator gives a signal, it cannot be known for sure, it is only estimated. A bear trend is when the downtrend pushes the lower band again and again, making a small rise after coming to the oversold region. In this way, it exhibits a stronger decline in bear dominance.
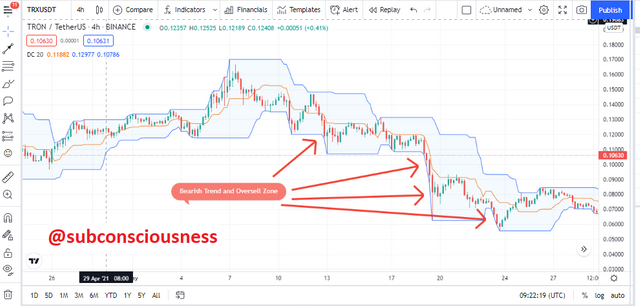 Source: Bearish Trend on TRX/USDT on tradingview
Volatility Review
Since Donchian Channels directly creates its channel with Highest High and Lowest Low values, the most precise and clear information it can give us is the volatility information in the market.
- Volatility is high when the distance between the upper and lower band of the channel becomes longer, in other words, when the gap between the high and low channel is large. In times of high volatility, price stability cannot be fully mentioned.
- When the distance between the upper and lower band of the channel decreases, in other words, when the gap between the high and low channel is small, volatility is low. When volatility is low, it can be said that the price is stable and the market is stagnant.
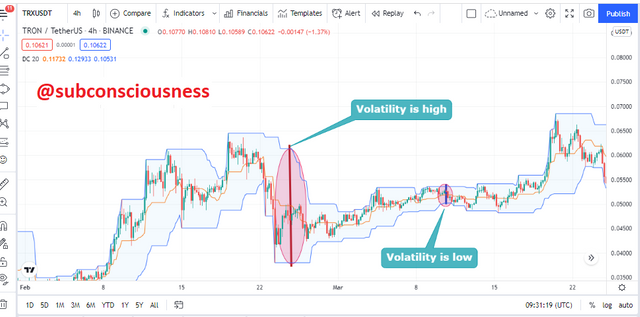 Source: Volatility on TRX/USDT on tradingview
After the usage examples given above, we can summarize as follows. The Donchian Channels indicator is used to get reversal signals about the volatility of the market, in trend breakouts, overbought and oversold situations.
4.Realiza 1 entrada utilizando la "Estrategia de Ruptura de los Canales de Donchian" y realiza 1 entrada utilizando la "Estrategia de Reversión y Retroceso" . Debes explicar el paso a paso de como analizaste para tomar tu entrada y hacerlas en una cuenta demo para yo evaluar como fue tomada la operation.
Donchian Channel Breakout Strategy
Here's how to implement a breakout strategy with Donchian Channel. Once the price candle rises and touches the upper band of the channel, it will likely go up. New highest highs are formed in an uptrend. Even if there is a decrease in the price, if it returns from the middle band and touches the high band again, it is necessary to take advantage of the bull trend. Since we are talking about probabilities, it is important not to forget to put a stop-loss at a close point. This is how the breakout strategy is used with the Donchian Channel.
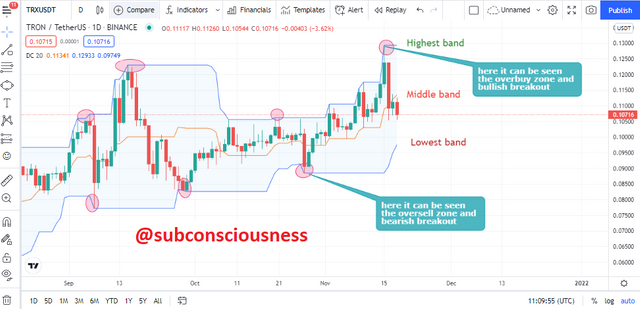 Source: Donchian Channel Breakout Strategy on TRX/USDT on tradingview
Reversal and Retracement Strategy
Here's how to apply an inversion strategy with the Donchian Channel. When in a bullish trend, the price usually zig-zags between the upper band and the middle band. In a bear trend, the price usually zig-zags between the lower band and the middle band. A breakout of the middle band line reveals the possibility of a trend reversal. It should be interpreted that the middle channel line breaks down in a bullish trend and an upward crossing of the middle channel line in a bear trend. Not every intersection means that the trend will return. An indicator alone is not sufficient for technical analysis.
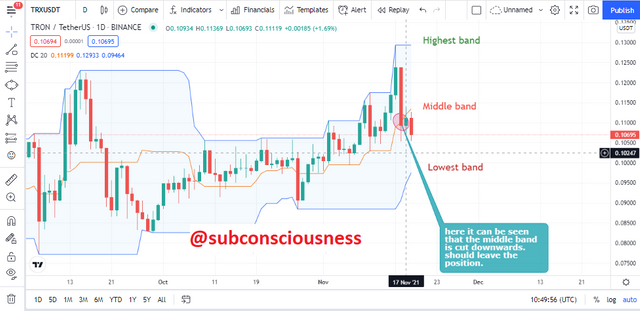 Source: Reversal and Retracement Strategy on TRX/USDT on tradingview
I will explain how to trade with the Breakout Strategy and Reversal and Retracement Strategy that I mentioned above.
First, we need to log in to the demo account. Then we select the trx/usdt crypto pair and add the Donchian channel indicator after our graph is opened. In the screenshot I shared in the breakout strategy, since the marked points are overbought and oversold points, we can trade there. We made purchases at the points where the price touched the lower band. The price crossing the middle band to the upside strengthened the buy signal and showed us that there is a reversal. It means we're in the right place. When it touched the upper band, we made our sale. In the screenshot I shared in Reversal and Retracement Strategy, it is seen that the price has cut the middle band downwards. Here it means that the decline has started again. I will not buy back until I touch or approach the lower band again.
Conclusion.
In this homework, we learned how Donchian Channels work, its logic and how we can apply it. It will definitely be beneficial to use this indicator, which is one of the important technical analysis tools, in our analysis. But it should not be forgotten that as I mentioned in my homework; with a signal received from any indicator alone, should not be entered to position or left out from position. The received signal should also be interrogated with different indicators.
Cc:
@lenonmc21
All screenshots are taken from Tradingview and Gate.io . None of the charts or information I have included here are investment advice. They are amateurish assignments that I prepared for educational purposes only. Thus, we have come to the end of our homework by answering all the questions. Thanks in advance for the review, professor.

Thanks for your visit.
💪💪💪Being a member of #club100 has privileged rights.💪💪💪
🙋♂👇tay Tuned for my Next Post & Stay Well...🙏


@tipu curate
Upvoted 👌 (Mana: 2/6) Get profit votes with @tipU :)
Have a Happy #club100 Day 😀