On-chain Metrics(Part-2)- Steemit Crypto Academy- Season4 Week3- Homework Post for @sapwood
Hi all. Today I will be submitting my assignment for professor sapwood’s course on On-Chain metrics
(1) What is the difference between Realized Cap & Market Cap, How do you calculate Realized Cap in UTXO accounting structures? Explain with examples?
We have all seen the massive market cap of the entire crypto market on Coinmarketcap right. This number which is currently in the Trillions is the combined market cap of all the cryptocurrencies.
Market cap is calculated by simply multiplying the latest selling price of a crypto asset like Bitcoin and the total number of coins/tokens in circulation. (Last selling price x Total circulating supply) This definitely makes it seem like a more glorious number. However, this is not the price that every holder paid to acquire the asset.
The realized cap is the price at which the assets were moved by others. Simply put, the realized market cap is the amount of fiat that people actually used to buy crypto. Obviously, the price that a person paid to buy Bitcoin a decade ago would be lower than its current price. This consequently means that the realized cap would be lower than the market cap of a particular cryptocurrency.
Let’s say you bought 1 BTC back in 2011 for $40 and you held it till now. So, the realized cap of BTC for your BTC was just $40. As soon as you sell it at its current price of $42,040, the realized cap of BTC would go up by $42,000. So, the realized cap is actually recalculated every time a coin that was bought in the past is sold. Keeping track of the last moving price of every single asset makes realized cap more advanced than the regular market cap.
Since the realized cap takes the last moving price of every single asset into account, its value does not change drastically. The same cannot be said about market cap though. If there is bad news announced on the internet, we immediately see the market cap of all cryptocurrencies taking a drastic hit.
How do you calculate Realized Cap in UTXO accounting structures? Explain with examples?
UTXO stands for Unspent Transaction Output. As the name suggests, it is the unspent part of a particular transaction. A Bitcoin transaction for example has an input/set of inputs and an output/set of outputs. Any part of the input that is not included in the output would be a UTXO.
As discussed earlier, the realized cap is the cumulative price of crypto at the time it is moved.
Let’s say that you have bought 10 BTC back in 2010 for $10 and never spent this, then the realized market cap is equal to its last UTXO which was $10.
Now, if you decide to spend 3 BTC on something, you would transfer 3 BTC to a different wallet. As the current price of BTC is over $42,000, this transfer would increase the realized cap.
Additionally, now the previous UTXO is split into 2 UTXOs, one containing 3 BTC and the other having 7 BTC, and the current value of each BTC in these two UTXOs at this time would be $42,000(the price at which you moved your BTC)
Let us now take an example of imaginary crypto called X which follows the UTXO model and has only 10 tokens in supply. Users A, B, C all buy crypto X at different prices. ‘A’ buys 2 tokens for $10, ‘B’ buys 5 tokens for $6 and C buys 2 tokens for $40. Now after a few days, the current value of the coin is $100.
The market cap of crypto X would now be $100x10=$1000. The realized cap would be different.
In the above example, users A, B, C are don’t move their tokens. However, the 1 token that some other user bought has traded it and thus, the current price that it is selling at is $100.
Now, the realized cap of this crypto would be,
(2x$10) + (5x$6) + (2x$40) + (1x$100) = $230
Now if the user ‘A’ moves his token at the current value of $100, then the realized cap would increase to $410.
(2) Consider the on-chain metrics-- Realized Cap, Market Cap, MVRV Ratio, etc, from any reliable source(Santiment, Glassnode, etc), and create a fundamental analysis model for any UTXO based crypto, e.g. BTC, LTC [create a model for both short-term(up to 3 months) & long-term(more than a year) & compare] and determine the price trend/predict the market (or correlate the data with the price trend)w.r.t. the on-chain metrics? Examples/Analysis/Screenshot?
We have already discussed what a market cap and realized cap is. Let us now have a look at MVRV.
MVRV is the market cap to realized cap ratio of crypto. It is calculated as follows.
MVRV = market cap/realized cap.
This parameter is one of the factors that some traders consider to see if crypto is overvalued or undervalued. If this ratio is less than 1(or negative %) then the crypto is undervalued, if it is exactly 1 then every holder can break even, and if it is above well over one, then the crypto is overvalued.
Let us now do some analysis on the Bitcoin price history using all these 3 on-chain metrics.
90-day Short term analysis:
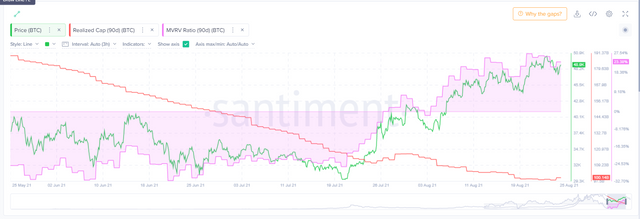
90 day metrics
The above screenshot has all the metrics in one chart between the periods of 26th May to 26th August.
We can see that the MVRV ratio correlates closely with the price of BTC. As mentioned earlier, if the MVRV ratio is in the negative %. This means that the price was undervalued. This kept on going until July 21st when the prices finally started to recover. Consequently, the MVRV graph also started its uptrend from this date.
Throughout this 3 month period, the realized cap has been going down. This is because of all the new people who might be selling these coins at a loss. Additionally, this also means that the older crypto holders who have not moved their funds for several years are still reluctant to sell their position. This would eventually get flattered as more weak hands are shaken off.
365-day on-chain metrics analysis:
The 365-day metrics are very interesting as we get to see the different cycles that Bitcoin has gone through.
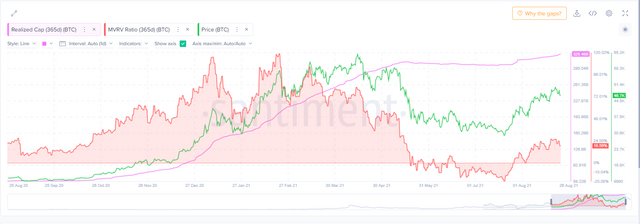
365 days data of BTC
In this screenshot, we can see that the price of Bitcoin and the realized cap correlate with each other. It was in August 2020 that Bitcoin had finally reached $10,000 price and was trading at this range for a while. The price soon started to increase given the added scarcity due to the halving event last year.
The uptrend continued till its peak in April. During this time, the bullish Bitcoin was breaking all previous price records. The MVRV was over 100% at this time. So, this means that BTC was overvalued and a correction was imminent.
Since then, the BTC market is yet to retest the $60,000 price. As the MVRV indicated, the BTC price soon took a hit. However, observe that the realized cap soon lost parity with the price of BTC. This is probably because of old investors selling their crypto as well as new users who bought at a higher price selling at a loss. These actions together help stabilize the line making it appear like it is currently flattening out.
(3) Is the MVRV ratio useful in predict a trend and take a position? How reliable are the upper threshold and lower threshold of the MVRV ratio and what does it signify? Under what condition the Realized cap will produce a steep downtrend? Explain with Examples/Screenshot?
From the previous analysis, it is clear that MVRV can be very useful in predicting the price of crypto. The upper trend might be a bit hard to use as crypto can easily do a 3x even though the MVRV is over 100%.
The downtrend of MVRV is pretty significant. This helps to identify a market dip and will help to get in at a good time. In the above graphs, the investors who bought during June and July 2021 would be in the green as the markets ended up going up after this small correction period.
The lower thresholds of MVRV are significant to anyone who wants to get into the market i.e. buy crypto. This lower bough signifies a correction or an accumulation phase in crypto. What follows is usually another run-up. At least from the past data, the accumulation phase is followed by a run-up. So, getting in during this phase can be extremely useful for any investor.
Realized cap produces a downtrend:
The realized cap could produce a steep downtrend if the new investors who got in at a higher price end up moving their coins at a lower price(sell at a lower price). At the same time, the diamond hands(Investors who bought the crypto very long back) don’t sell.
This results in the re-evaluation of the realized cap to a lower value. When this happens on a large scale, we can see a steep decline in the realized cap. The 3-month data of BTC is a good example of this.
The recent news has definitely shaken all the new investors who entered at a higher price. This has led many to sell their crypto at a loss. The diamond hands have come across several such news in the past and have learned from their mistakes. So, the UTXO of their coins would still be the lower value at which they had bought it.
Another example would be considering crypto X having a total supply of 10 tokens. ‘A’ has bought 3 tokens at $10, B has bought 5 tokens at $8 and ‘C’ has bought 2 tokens for $100.
At this point, the realized cap is (3x$10) + (5x$8) + (2x$100) = $270.
Now, ‘C’ decides to sell 1 token for $20(at a loss) to ‘D’. Her new UTXO would be $20. The realized cap would now be recalculated as follows.
(3x$10) + (5x$8) + (1x$20) + (1x$20) = $110
This is a steep decline in the realized cap. This is because the new investor ‘C’ sold at a loss while the old investors did not sell their tokens.
Conclusion:
On-chain metrics like MVRV can be extremely useful to predict the price movement of a particular crypto. However, it is not foolproof. The downtrend of MVRV could stay there for a long time if more bad news emerge on the internet.
Additionally, the uptrend also depends on the news. Sometimes, a coin that is already up might end up going even higher. So, if you do decide to use on-chain metrics, understand the risks involved as well.