Steemit crypto academy season 4 // homework post for professor @reminiscence on technical indicators
Greetings to everyone, I really want to commend the efforts of @reminiscence01 in putting together a wonderful lesson on technical indicators, The lesson was really helpful. Below are the answers to the questions that were asked after the lecture.
in your own words, explain technical indicators and why it is a good technical analysis tool.
Technical indicators are simply technical tools designed in other to help traders spot or identify market trends. It uses historical data to calculate the price, volumes of trades which will help provide the trader with the necessary information needed to determine the entry and exit points in a market.
This tool is very significant in technical analysis because it provides the trader with a clear understanding of the market trend through its various chart pattern. Technical indicators can be very helpful in understanding the dynamics of the market which is purely based on human sentiments. This information guides the prediction of future market trends.
The entry and exit points of a market can easily be predicted through the use of technical indicators, this is fundamental in the mitigation of losses in the market. However, a trader must use the indicator that best suits her purpose as we have alot of them. They could also be combined together, to have a more accurate and precise result.

Are technical indicators good for cryptocurrency analysis? Explain your answer.
Technical indicators can be used on any trading data including currencies, forex, stocks, cryptocurrencies etc. Any asset requiring the input of historical data to determine its future trend, requires the use of technical indicator.
In the analysis of cryptocurrencies, technical indicators are essential to help spot market uncertainties.
Cryptocurrency being a digital currency and operating on a decentralised block chain technology, is a very volatile asset and requires the knowledge of price movements which can only be computed with technical indicators. These information presented in form of charts, helps to guide the trader in knowing the market trend, the appropriate time to buy a coin and when to sell it off. This information is paramount for a better understanding of the decentralised system.
Technical indication is most suitable for the analysis of short term price movement, this makes it a veritable tool and an excellent mechanism for the analysis of cryptocurrencies.
Illustrate how to add indicators on the chart and also how to configure them. (Screenshot needed).
• In other to add indicators to charts, you first go to https://tradingview.com
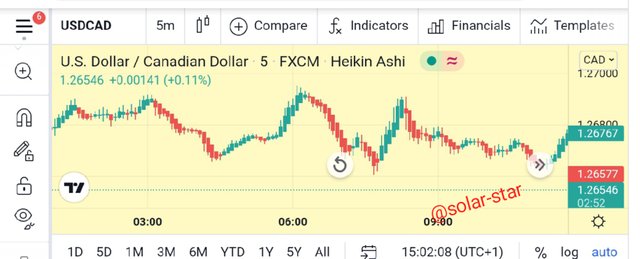
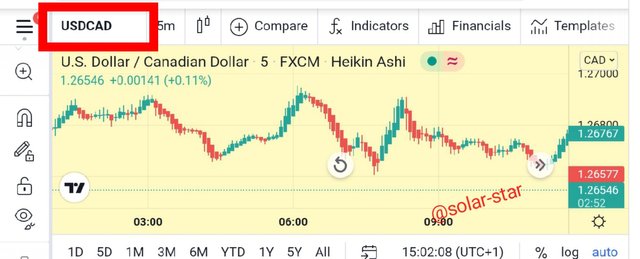
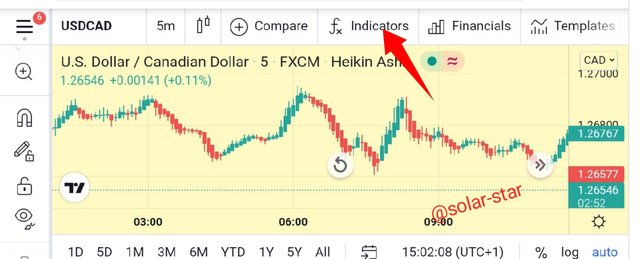
• For the illustration purpose, I'll be using the USDCAD trading pair as highlighted below
• Click on the fx indicator icon at the top just as shown below
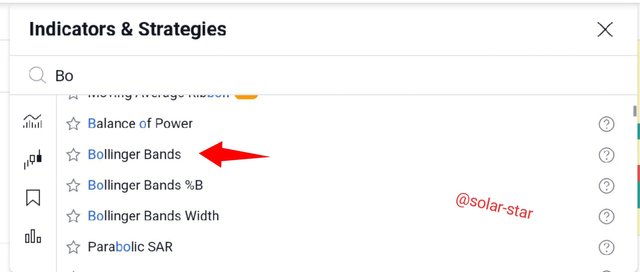
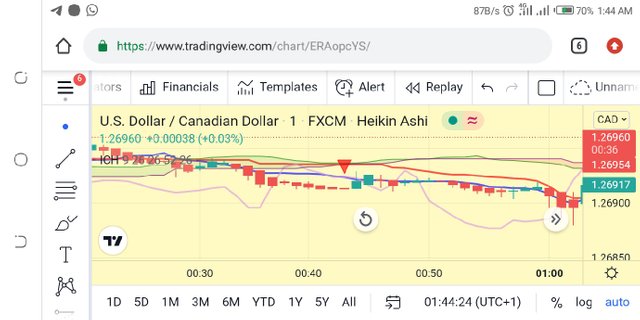
• Search for any indicator of your choice as there are many of them. In my own case, I'll be using the bolinger band just as shown below.
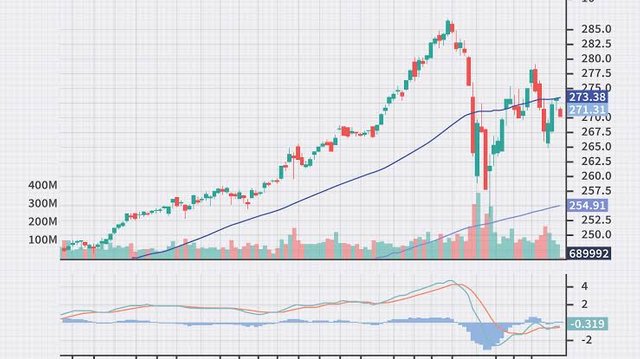
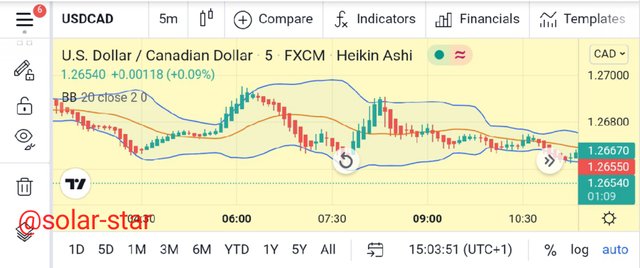
• After selecting the indicator, close the pop up menu as the indicator has been added successfully just as shown below
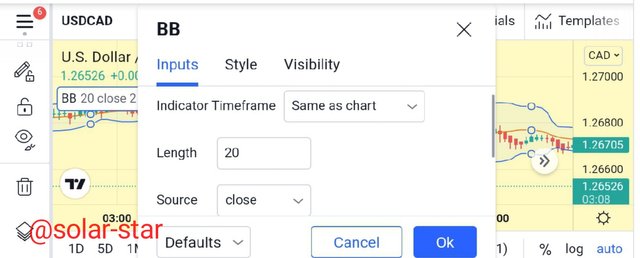
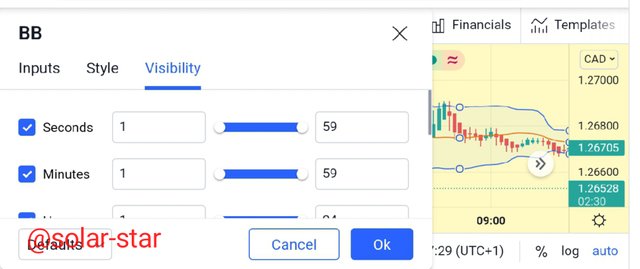
To configure the indicator, click on the setting Icon and change any of the set up under the input section, style section, or the visibility section Just as shown below. I prefer mine to be on default

Explain the different categories of Technical indicators and give an example of each category. Also, show the indicators used as an example on your chart. (Screenshot needed)
There are many types of indicators out there, but their usage is solely dependent on the trader knowledge about them and the style or pattern of trade a trader favours.
• Trend indicator: this was designed to help trader identify the current trend in the market. This helps in guiding the trader on the right decision to make as its always advisable to follow the market trend.
This indicators also signal a change in trend which could be very helpful to a trader as its risky to trade against the trend. Some examples of the trend indicators include; simple moving average, exponential moving average,Ichimoku kuko hyo
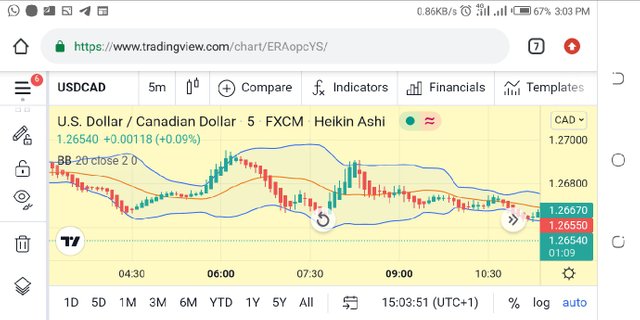
• volatility based indicator: these indicators are designed to study the rate of volatility in the market. They measure market swings i.e the upward and downward swing. This information guides the trader in knowing when to buy at a low, and when to sell at a high cost. Some examples of this indicators includes average true range(ATR), bollinger bands, ADX, etc.
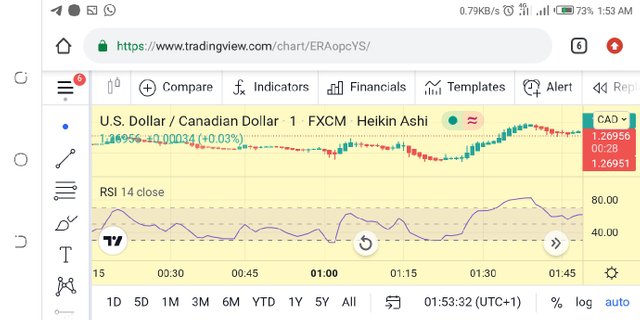
• momentum indicator: these indicators are designed to study the strength of a trend, that is how long a trend will last. They are also known as oscillators.
They are helpful in giving insights to as when a particular asset is overbought or over sold. Traders can take advantage of the over bought region and make profits.
However, this indicators are not 100% reliable as they only indicate when a trend starts to run out of momentum. Examples of this indicators include; relative strength index (RSI), stochastics, etc.
Briefly explain the reason why indicators are not advisable to be used as a standalone tool for technical analysis.
Indicators are not advisable to be used alone because in the digital market, so many things determine the market force. Every indicator has its own advantages and disadvantages, hence its purely at the discretion of the trader to determine which to use, as its the trader that will make the final decision regarding trade.
Technical analysis does not only require the use of technical indicators, the mentality and ideology of the trader also plays a significant role as no indicator is 100% efficient. Market uncertainties can occur anytime, a good trader should not only rely on one indicator for signals as comparative advantage requires the use of two or more indicators so as to increase the accuracy and precision of the result.
Explain how an investor can increase the success rate of a technical indicator signal.
Success rate of a technical indicator can be increase with the use of two or more indicators to confirm a particular signal. An investor needs to be highly knowledgable so as to ascertain which indicator is best suitable for a particular trade and also having the understanding of chart patterns. So knowledge is as essential as the indicator itself.
However, its often advisable to use two or more indicators as this will help give a clearer picture and also increase the accuracy of the result as no indicator is 100% certain.
conclusion
Technical indicators plays a very vital role in the determination of the market trend, volatility, momentum etc. These 3 indices influences the trader decision in the market. All traders should know which indicator best suits their purpose and stick with them as too many indicators may tend to be ambiguous which might confuse the trader.
Nice