Steemit Crypto Academy Season 2-Week 8 | Cryptocurrency Trading with Bollinger Bands For @kouba01
Hello everyone, I am so excited to partake in this week's crypto homework task, due to one or two reasons, I was not able to partake in last week's crypto but thank God I am okay with this and here I am to make my submissions for professor @kouba01.
This week's homework task is all about Trading with Bollinger Bands on cryptocurrencies. My submission will be based on the questions that have been asked by the professor.
Define the Bollinger Bands indicator by explaining its calculation method, how does it work? and what is the best Bollinger Band setup?
The Bollinger Bands indicator (BBI) is defined as a trading tool used in determining the exit and entry points for a trade. It is done by making good use of its bands which determines the oversold and overbought conditions. Moreso, we will not live the fact that trading with the bands only is very risky, this is because the indicator only focuses on the prices and also the volatility while a lot of information relevant on the trad is ignored
John Bollinger is the inventor and developer of this great tool. It was developed in the1980s but he trademarked this in the year 2011.
The formula of the Bollinger Bands and its explanation.
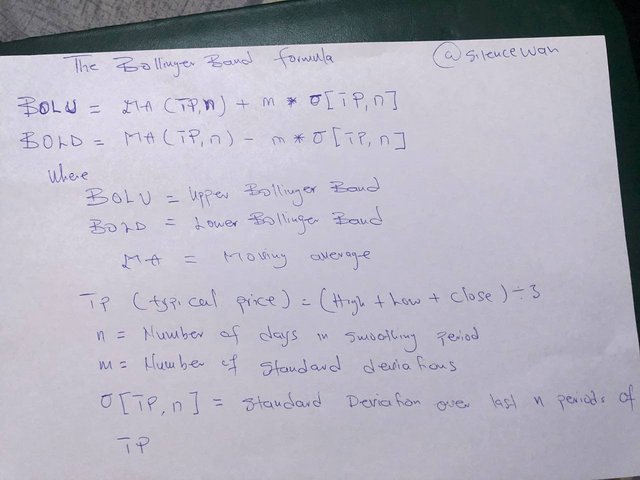
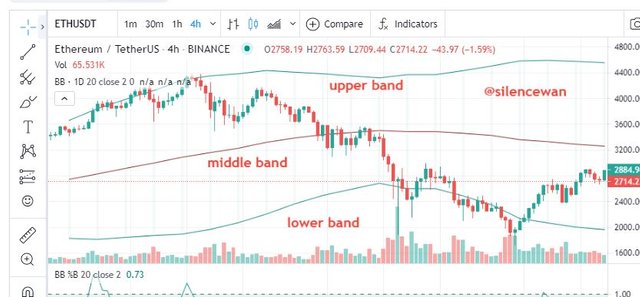
The chart below can be used to explain better for the point stated in the image above containing much writing.
How Do the Bollinger Bands work
the Bollinger Bands works by using the w-patterns which then identifies W-Buttons when the 2nd low is said to be lower than the 1st low but holds above the said lower band. When this happens, there is also a reaction that forms below the lower band. What is then seen is, the price is said to pull back leading towards the middle band or higher which then creates a new price low holding the lower band.
what is the best Bollinger Band setup?
According to the developer of this great tool, John Bollinger. He has recommended or suggested that the settings should be between 9 and 12 (9-12). But some say the best settings should or is 2 and when you set it to 12, you will notice that in an uptrend, the upper Bollinger Band points and the prices continuously and constantly touches the Upper Bollinger Band which shows is actually the best Bollinger Band setup
Setting up the Bollinger Bands using Trading view with the help of Coinmarketcap
- Log onto this website, coinmarketcap
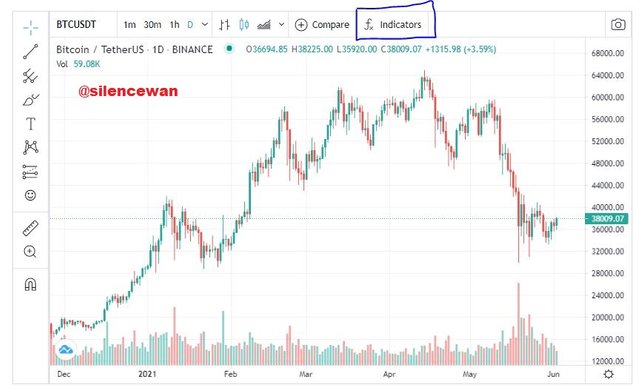
Once it logs on, you select the coin you want to perform the task on, in my case, I selected BTC/Tether US. Once it comes to the trading view point, you will see indicators at the top right hand-side of the window, select or click on the indicators.
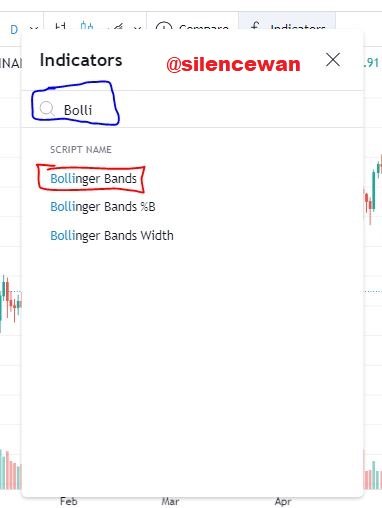
Once you click on it, a search box will appear, in the search box you will need to type Bollinger Band and it will show automatically. As soon as you click on it in the list of Bollinger Bands that appear, exit that window.
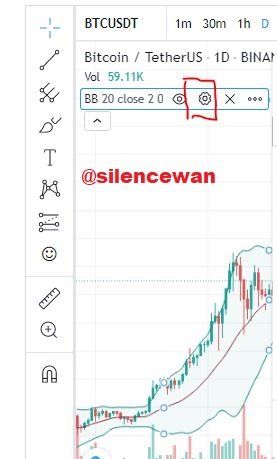
Here, we then want to configure the settings, you will see an arrow pointing up at the left top corner of the window, once you get there check for for a bar containing BB settings which is the Bollinger Band. you will see a settings button, select it to proceed further in other to make changes to the settings. Show below in the screenshot.
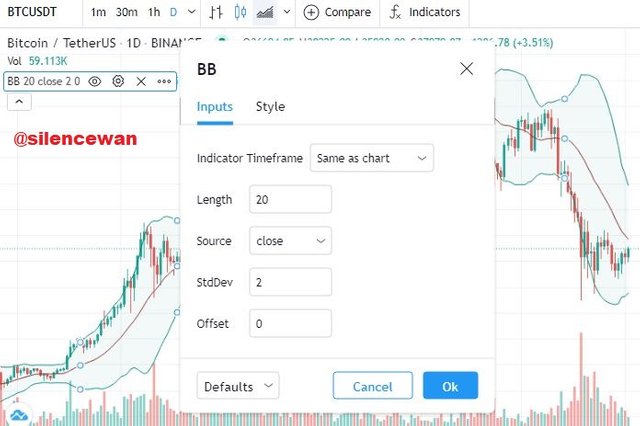
Here, is set to default, which is the normal and most appropriate way since all the ranges falls within as said by the developer.
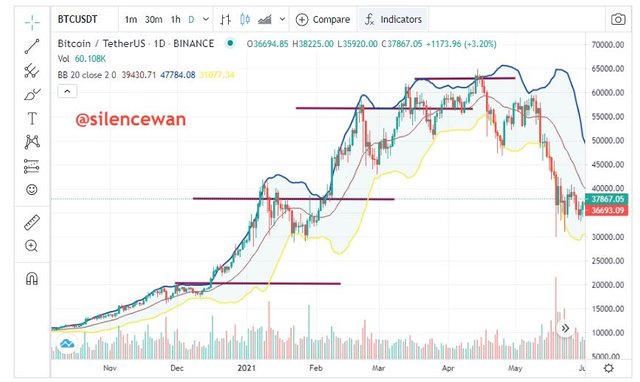
What is a breakout and how do you determine it? (Screenshot required)
We can say that, playing the bands oppositely and betting on reversion with the mean is termed playing Bollinger Band breakout.
We can then say that, the breakout is said to occur when after due to some period of consolidations, also when prices closes from outside the Bollinger bands is termed breakout and i will be teaching you how it is determined.
I have indicated my breakouts in the diagram below I took in the trading view using coinmarketcap
How to use Bollinger bands with a trending market? (screenshot required)
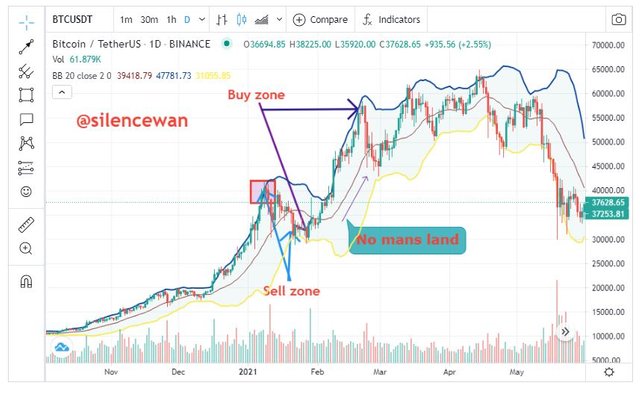
Upon trying to to establish the fundamental and basic rules of the Bollinger Band, it is seen that, I can make my demonstrations on how to use this tool in your trading market. Mind you, we have the trend-traders and the the fade-traders. The trend-traders are there t make more exploitations whiles the fade-traders are just in the trade to make some profit from the trend reversals or trend exhaustion.
Looking at my chart above, it is seen that, the trend traders in this chart as I have indicated will position the buy zone to the long trends thereby aiding them to stay in the trade as the BB closes the needed price actions as the trend mover higher.
For making exits, any trader involved in using this tool will definitely know when to exit as the trend stays in the no mans land for a while, immediately it reachs its peak, it will come back to the sell zone, so you do the needful.
What is the best indicator to use with Bollinger Bands to make your trade more meaningful? (Screenshot required) (Screenshot required)
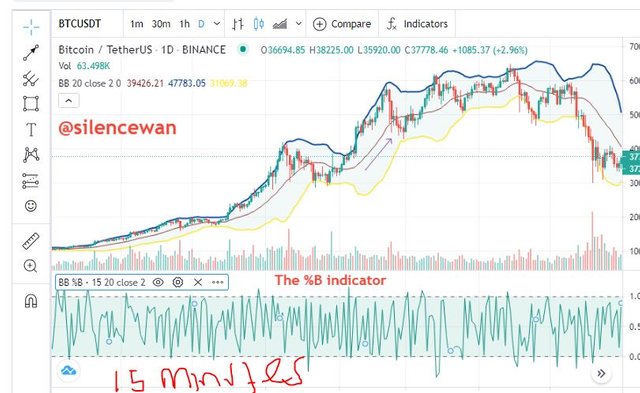
The best and most regarded Indicator to use with the Bollinger Bands in attempt to make trading meaningful is the %B indicator. This indicator actually works by plotting in percentages the stock's closing price of both the upper and the lower bands. Its said that, the upper band is noted or identified by the 1.0 mark, where the middle band is identified by 0.5 and lastly, the lower band is identified with a 0 mark So in this case, the %B will show and indicate how the stock current price is close to that of the bands.
The %B indicator shown in the chart below
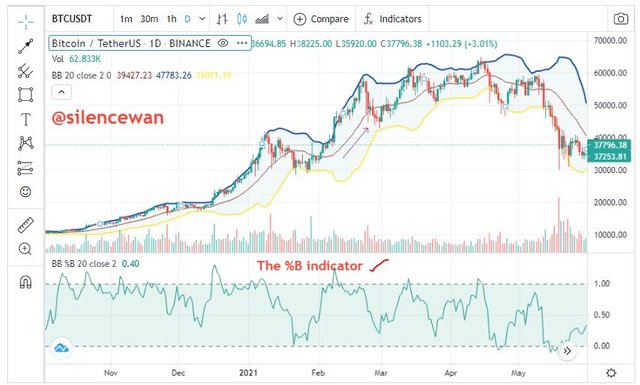
Beneath the chart, the button, part you see how its plotted in the rectangle as I have explained the beginning
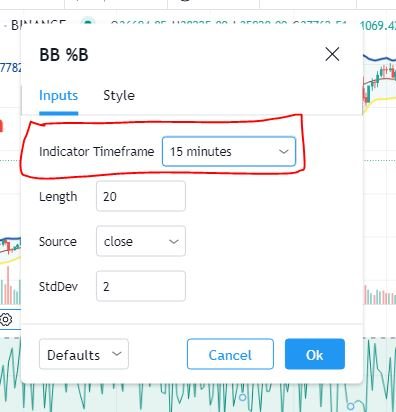
What timeframe does the Bollinger Bands work best on?And why? (Screenshots required)
Here, i will say that there is not a specific or specified timeframe to use when using the Bollinger bands, per my submissions, the concept is applicable to all timefraes. But this is dependent on the caliber of trader we dealing wit, his trading style and approach is the most important thing. As I said, if the trader we are considering is a day trader, then the tradeer will consider the Bollinger Bands on the lower timeframe. Such timeframes are 15 minutes and 5 minutes.
But also, if you are a swing or position trader, the trader will have to use the Bollinger Bands on the daily or weekly timeframe
In a case the trader is a day trader, you set to 15 minutes as shown below
How the chart looks like for the day trade (15 minutes)
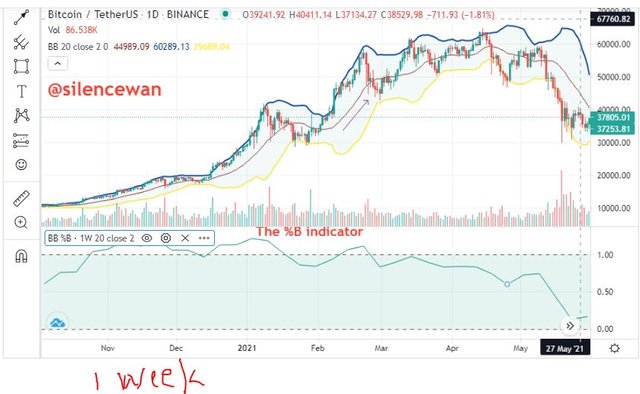
Here, if the trader is a swing or position trader, the settings should be set to either a day or a week which I have st to a week, shown in the chart below.
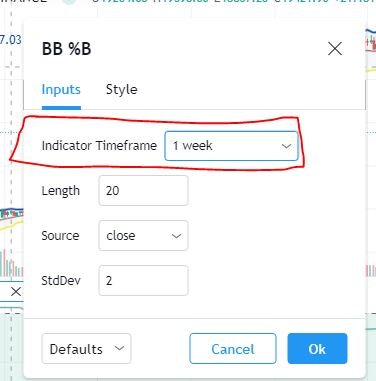
How the chart looks like for the Bollinger Bands for position trader.
Review the chart of any pair and present the various signals giving by the indicator Bollinger Bands. (Screenshot required)
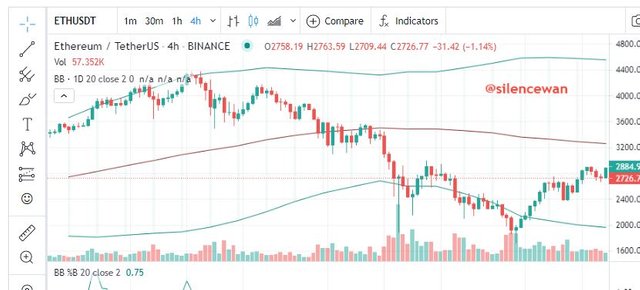
This is a 4 hour timeframe of the ETH/USDT pair, looking at the chart above, it is totally true that, the was a buy order of this pair since the prices had to bounce below the lower band of the indicator. Its totally evident that, there was a buy order. Belowis also the
Using the 1 hour time frame of the xrp/usd pair, it is evident enough that we have a buy order, as prices just bounced off the lower band of the indicator. To indicate or add more value, i will use the stochastic indicator again.
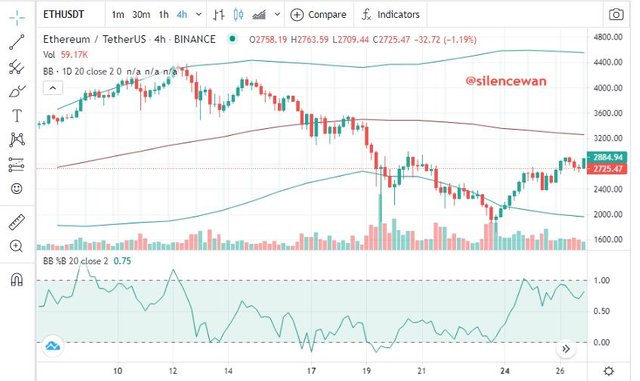
This is the %B indicator, which has proven my claim of the fact that the prices had bounce below the lower Bands and therefore an initiation of a buy order. Show in the screen shot aove.
Conclusion.
I will conclude by saying that, the Bollinger nads is a great tool whichis used to locate cases of oversold andoverbought of assets in the market taking into consideration the volatility of the asset. Moreso, the Bollinger bands is also used in the determination of trends and lastly, the %B indicator helps qualifies the Bollinger Band indicator to give out good results when making analysis.
Thansk to professor @kouba01 for this wonderful topic chosen.
Hi @silencewan
Thanks for participating in the Steemit Crypto Academy
Feedback
This is good content. Thanks for demonstrating your understanding of the Bollinger bands trading tool.
Homework task
7
Thank you professor