Steemit Crypto Academy| Week 2 by Professor @steem4u- How To Read Candlestick Charts In Different Time Frame & Information about Buy-Sell | Support & Resistance
A new trader in this trading world. Still learning. Trading is a passionate profession where if you take trading as a serious business your career will be settled here. I am a new crypto trader. I have learned a lot from the lessons of Professor @ steem4u and I will highlight them in this post. How to read candlesticks at different times frame.
A trader must be disciplined and very careful to follow the rules. Because if you make a mistake, you will lose your wealth. It is certainly not a child's play. One of the tricks of the trade is the value of time. The right step at the right time is the mark of a successful trader. Because crypto charts change 5, 15, 30, 45, 1 hour, month and even year. So a trader must master these things well.
Let's dive down, Usually before we start trading we need to know the basics of trading. When it comes to trading charts, every trading chart has a candle stick. Candle sticks help to understand the price movement of a coin in the market. As I said above, time frame is important. You have to choose what period you will trade.
Scalping:
The scalping trick is basically used to trade a short term. These scaling tricks are used to make a profit from the smallest movement in the market. However, this technique has to be very disciplined and have knowledge about the market. However, this technique requires to be very disciplined and have knowledge about the market.
There are several types of marriage traders in crypto trading. I will discuss two types of traders here.
Day Trader:
Day trading uses crypto a lot. This is the most used technique. If a trader enters a trade and leaves the trade on the same day, it is called day trading. In this training entry and exit are taken according to the movement of the market. Day traders monitor the market throughout the day. They trade according to market trends. They enter trading most of the time by reviewing the 4 hour chart. He must have a deep knowledge of the market if he wants to be successful in day trade. They do his technical analysis on the 4 hour chart and take the type of trade. They see the volume and enter the trade.
Long Term Trade :
They hold an asset and wait for the huge pump. He decides that even if the market goes down, they will not be able to sell it. It has to be held for a period of time, maybe weeks, months or even years. This trader also needs to be disciplined. He likes it when he makes a lot of profit, but he doesn't like it when the market goes down. So Must requires discipline.
What is the meaning of the Green and Red candle and Reading the Green and Red candle:
Candle stick charts are one of the most important tools for a trader. It depends on the price action. Also A trader can read a candle stick to get an idea of future price action.
.png)
The green candle indicates the closing price at the top and the opening price at the bottom. The red candle on the other hand indicates its opposite. Opening top and closing price bottom.
An particular asset candle chart in a different time frame:
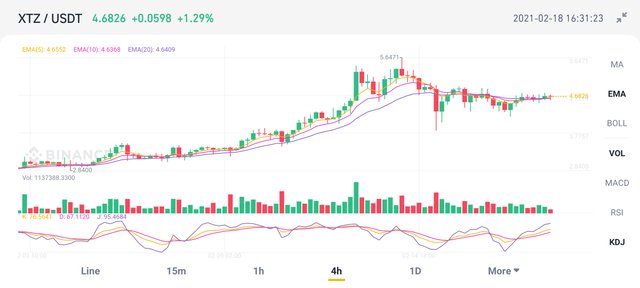
Screenshot taken from my binance account on XTZ/USDT pair.
As you can see in the screenshot, the chart is displayed in 4 hours time frame in xtz / usdt pair A time frame of 4 hours means that one candle will be made every four hours. The screenshot shows that the last candle stick is red, which means the price has gone down in the last four hours.
Support and resistance:
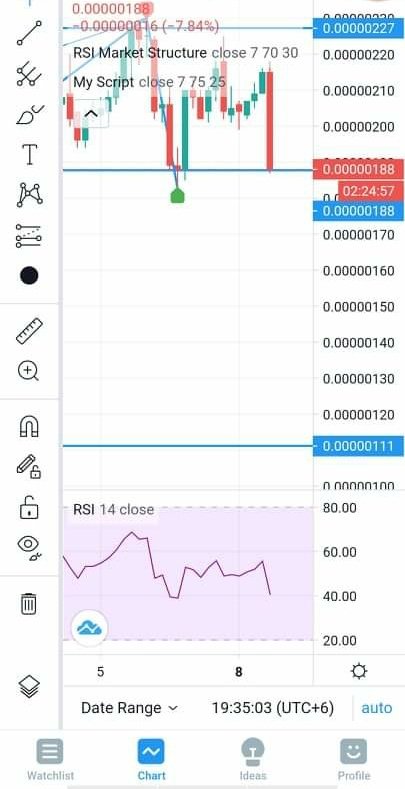
screenshot taken from trading view app
Support and resistance is an important issue in trading. As a trader you should do a technical analysis on a chart before going to any market. There you will see support line and resistance line. Buy at the support line and sell at the resistance line. This is one of the functions of support and resistance.
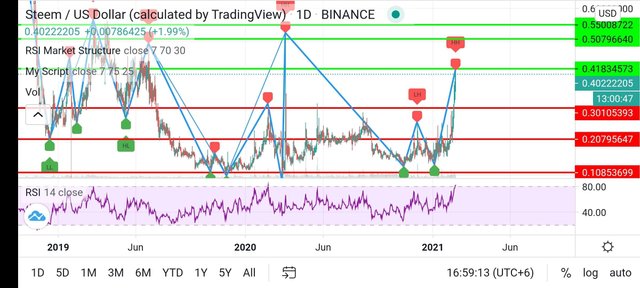
Screenshot taken from Trading view app
I analysis 4 hour and 1 day chart, 4h chart says it will go down for some time. And 1d chart says it will go to higher high means more pump.
According to the chart if price breaks .4184 and make a green candle above green line then it can .50 or even more. But the rsi level is 82+. So in my view it can dump now take a support at .30. If it's get support on the line it will again try to break the upper line. If not then it will dump more.
Thank You For Showing Your Intrest in Steemit Crypto Academy
You have completed the homework task and made a good post, explained very nicely about How To Read Candlestick Charts In Different Time Frame & Information about Buy-Sell(Support & Resistance).
Remark: Homework Task Completed.
Thank You.
@stream4u
Crypto Professors : Steemit Crypto Academy
#india #affable
Thank you so much for your kind reply.