Candlestick patterns - Steemit Crypto Academy Season 4 - Homework Post for [ @reminiscence01 ] Task 10.
Hello steemians out there!
Today I'm here to complete Steemit crypto academy season 4: Beginners course task 10 which is named as "Candlestick Patterns" and is given by professor @reminiscence01
So let's give it a shot without any delay 🎉
1a) Explain the Japanese candlestick chart? (Original screenshot required).
b) In your own words, explain why the Japanese Candlestick chart is the most used in the financial market.
c) Describe a bullish and a bearish candle. Also, explain its anatomy. (Original screenshot required)
- These are the questions which I have to explain under this home work task..
Let's start with first part of the question:

1a) Explain the Japanese candlestick chart? (Original screenshot required).
First of all we all need to know that what actually a Japanese candlestick chart is. And how it was started and now how it's going on.
Japanese candlestick chart is a tool specially we can say that a technical analysis tool which uses for analyze the price variability and movements of securities by the traders. It is a graphical and easy understandable representations of price of specific asset.
The Japanese candlestick chart's concept was given by Munehisa Homma who was a rice trader.
Homma graphically explained the nature of price movements by using Japanese candlestick chart. Furthermore Homma used different colours to denote the differences between them.
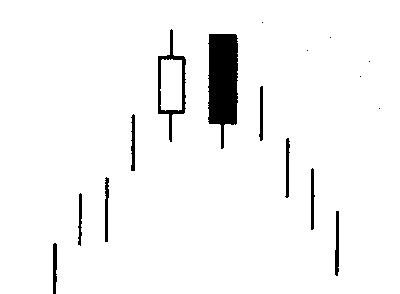
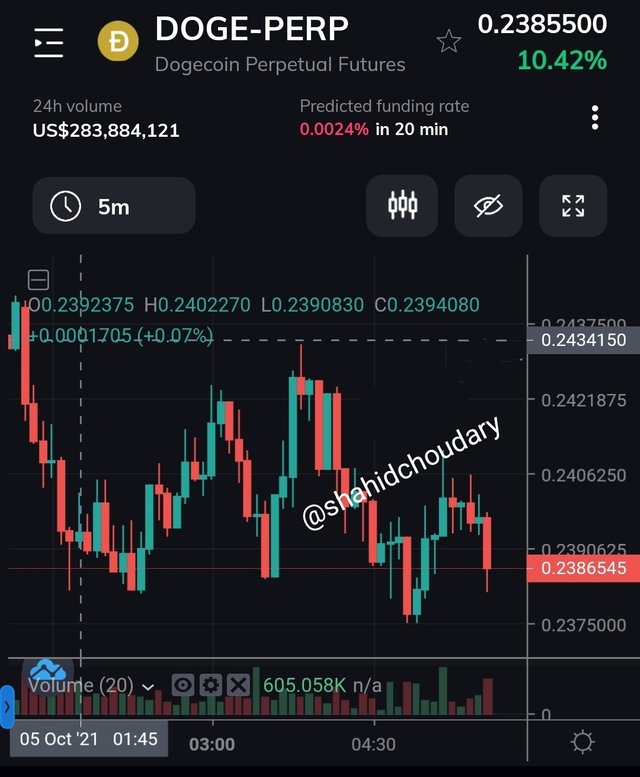
For most of the times there are only two colours which are green and red. The green candle shows that the price is just increased while on the other hand red candle shows that the price is just decrease. Looking into these candles it can also tell us about the current trend in market. Here is it's screenshot from FTX pro that is showing a candlestick chart.
b) In your own words, explain why the Japanese Candlestick chart is the most used in the financial market.
We use Japanese candlestick chart most of the time in financial markets. The reason is very simple. Through Japanese candlestick chart we can have more information of the movements of prices. Furthermore it also provide us a very accurate and detailed information of prices.
- In comparison with bar charts the above easiness of Japanese candlestick chart brings it on upper level. Japanese candlestick charts are more visuals than the bar charts. This is due to its colour coding. Open and close differences can better highlighted by using Japanese candlestick chart. While the bar chart can not difference between these things accurately.
The line lengths and the colour coding of candlestick charts helpful for determining that whether the market prices are growing or getting low.
This growing and weakening of market is known as Bearish and Bullish. In short the Japanese candlestick chart plays and important and essential role in this regard.
c) Describe a bullish and a bearish candle. Also, explain its anatomy. (Original screenshot required)
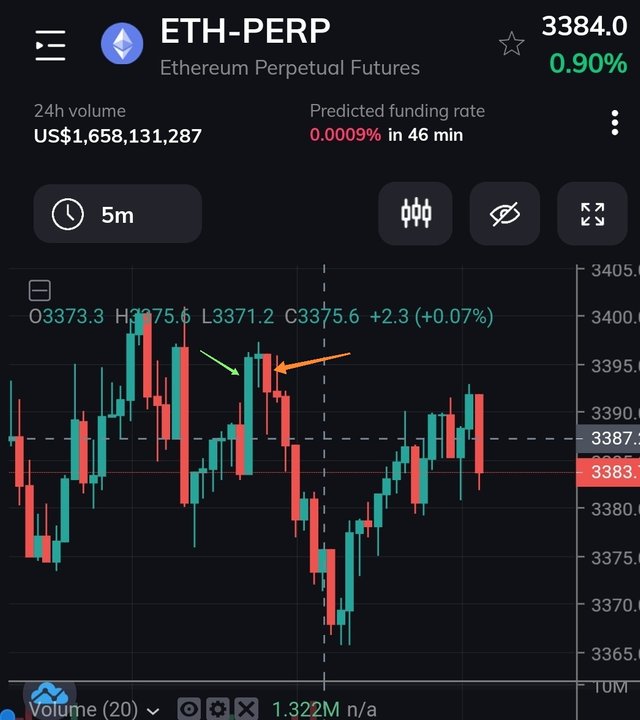
In Japanese candlestick chart we see two types of candles. The green and the red as I mentioned it above. The green one is called bullish candle and the red one is known as Bearish candle.
In the below screenshot you can see that green arrow is showing bullish candle while orange one is showing bearish candle.
But to confirm about the Bearish and Bullish trend we just cannot rely on a single candle. In fact if we want to tell about the current trend we have to look at the overall movements of candles. For example in the screenshot that I am attaching below you can notice a bullish and a bearish trend.
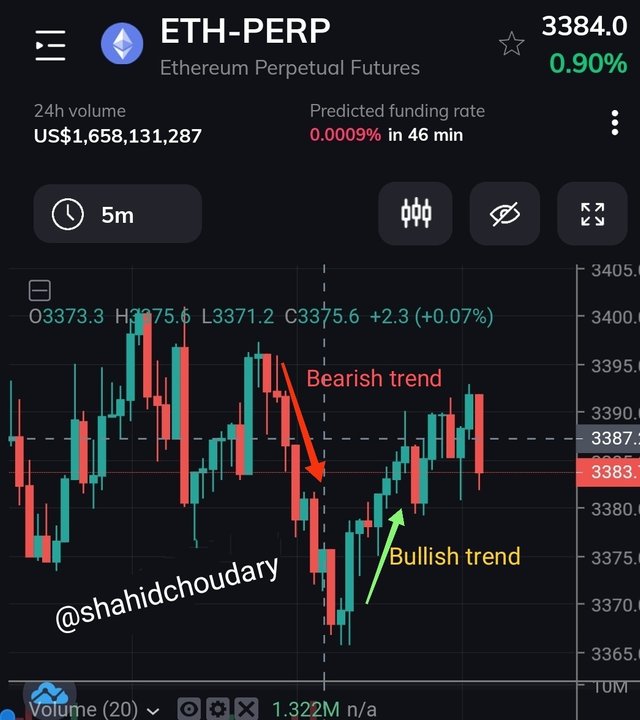
The bullish trend is best for purchasing because when bullish trend starts it is very likely to happen that there will be a continuous increase in market prices and on the other hand the bearish trend is the indications of selling. And you should leave the market in a bearish trend if you don't want to hold for a long time. Here it is important to mention that you should confirm these trends by using some indicators before making your final decision.
I HOPE YOU UNDERSTOOD IT. I TRIED MY BEST TO FULFILL ALL THE REQUIREMENTS BEFORE FINALISING MY POST.
THANKS 😊
- Submitted to :
prof. @reminiscence01 - Submitted by :
@shahidchoudary