Steemit Crypto Academy Season 2, Week 4 | Cryptocurrency Trading with RSI
Professor: @kouba01
#Course: Steemit Crypto Academy, Season 2, week 4
Topic: Cryptocurrency Trading with RSI
I am writing this post in response to the assignment task given by the professor @kouba01 , I really enjoyed, understood very clearly and really appreciate and thankful to you for your lecture realated to RSI indicator in Cryptocurrency Trading.
.jpg)
What is the Relative Strength Index - RSI and How is it Calculated?
RSI (The relative strength index) is an indicator tool which is used in technical analysis on the price chart of any kind of assets, crypto, stocks shares etc. . RSI shows the momentum in price change and overbought or oversold zones, we can determ,ine the price will go up or down . The RSI is displayed as an oscillator which moves up and down reading between 0 and 100. The indicator was first developed by J. Welles Wilder .
RSI is the most used trading indicator. Generally RSI level 30 or below is considered as the oversold area from where we can expect price to rise up and RSI level 70 or above is considered as overbought area from where the price is supposed to fall down. Price keep fluctuating up and down. RSI is used to filter out the probability of identifying price movement either it will go up or down. If RSI level is below than 30 level it is recommended to buy and id RSI level is avove it is recommeded to sell as the price may correct (correction).
NOTE: we cannot relay fully upon only RSI , sometimes or all the time this maynot work.
Calculation of RSI
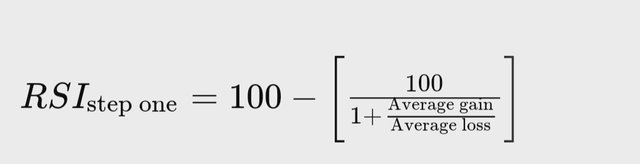
In the formula you can see RSI uses averages. So, RSI shows the momentum by averaging the different candles or the price. There is level from 0 to 100 so it calculates the different candles and by averaging them shows us levels. If the price is continuously going up then it shows as RSI level going up because the price of each candle is higher than the previous one. Similarly RSI level comes downward if the price is falling because each candles are lower than it's previous candles. The
Time frame is important here, if we choose RSI 14 which is by default, it means the RSI shows median level of previous 14 candles by averaging previous 14 candles's price . This is how RSI indicator works .
.jpg)
Can we trust the RSI on cryptocurrency trading and why?
Well , RSI is one of the most used indicator in all kind of financial markets like forex , stocks, crypto market etc. I personally also use and recommed everyone as well. It helps us analyze and predict the future probable price in financial markets. Similary in crypto market also RSI indicator is very much useful in analyzing the price or the market condition . It shows us overbought and oversold zones which helps us to figure out where to take trades and where to exit from the market. If the RSI level shows as oversold we can open trades in oversold zone because price is bound to go up and when it shows us level of over bought there we can close trade and avoid taking new trades in overbought area, price may reverse from that area. This is how it helps us in analyzing the market price probabilty.
But we should keep in the mind that there is no such indicator which can predict the future price of any specific market with 100% accuracy . Indicator is only a tool to get idea about probability of the price movement. In some extent it helps us to filter out and determine the probability if used properly along with some other tools and techniques.
RSI indicator is a lagging indicator which shows the current level by considering the past data. In order to increase the efficiency of RSI indicator i would recommend some other indicators and strategies like MACD Indicator and price movement strategies along with Simple or Exponential Moving Averages.
How do you configure the RSI indicator on the chart and what does the length parameter mean? Why is it equal to 14 by default? Can we change it?
Below i am showing how you can setup and use RSI indicator on the chart of any financial markets, here i am showing you on Tradingview website . I am showing how to use RSI on Cryptocurrency pair.
- Visit Tradingview
- Search for the crypto currency pair , here i have searched for BTC USD pair and click on full featured chart .
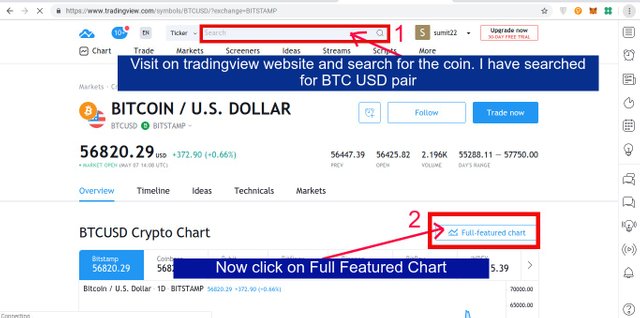
- Full Featured Chart will open where you can see BItcoin price on the chart
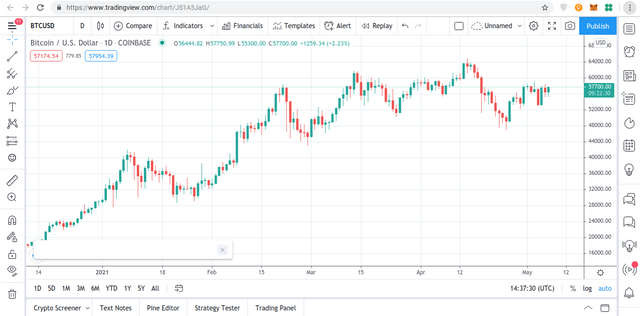
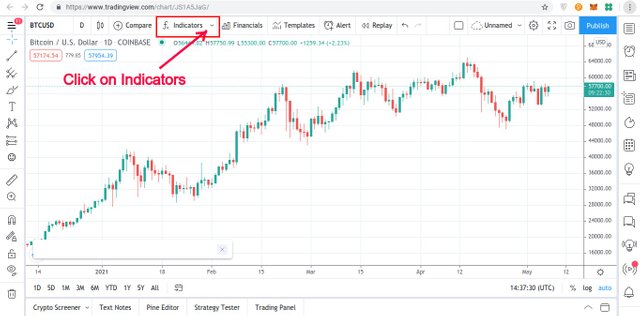
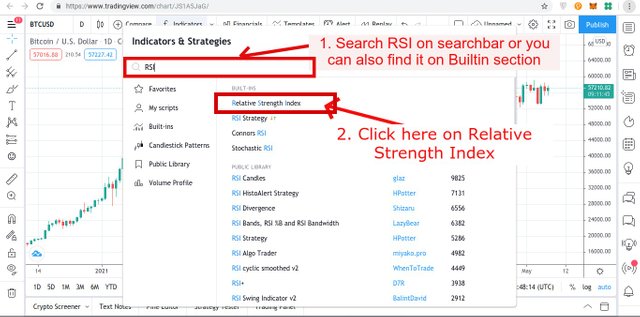
- Click on Indicators and list of indicators will dropdown, look for RSI (Relative Strength Index)
- Now search for RSI indcator - you can find it on builtin section or you can simply search for RSI and click on Relative Strength Index as shown on the image below
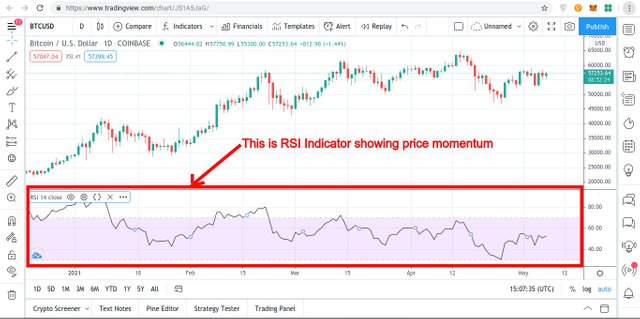
- See this this full featured chart with RSI Indicator
Configuring the RSI Indicator :
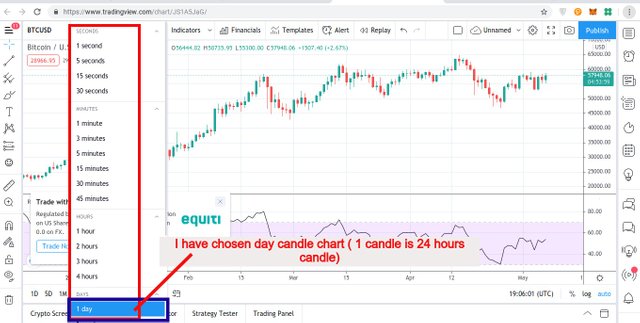
You can configure the chart as per your need and RSI will show you levels or price momentum according to the time frame of the candle you choose . Example : 1 min , 5 min, 15 min, 30 min, 1 hour, 4 hour, 1 day , weekly and monthly candle chart.
See how to change the chart as per your need
.jpg)
- Now you can choose different time frame of the chart for analyzing the price movement
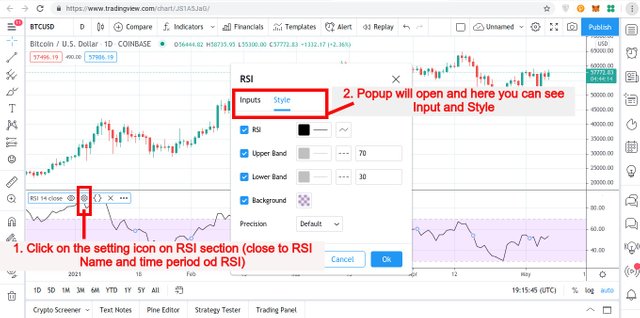
From input you can change the time period of RSI , default is 14.
From Style you can change the color of the RSI line , you can change the upper and lower bands color and levels , default is 30 and 70.
Length Parameter :
Length Parameter: RSI indicator calculates the movement of price according to the candles' high and low price, it calculates the averages price of the past candles and shows us momentum of price change in levels. Default parameter is 14 means it calculates the last 14 candles . Example: if we choose 1 day candle chart and default RSI is 14 so it will calculate last 14 days' candle and show us average price movement in RSI level.
Length paranmeter is very important in RSI and by default it is 14 because it has more accuracy than the other time frame or length parameter and yes we can change it , i have clearly shown above how we can change it.
How do you interpret the overbought and oversold signals when trading cryptocurrencies?
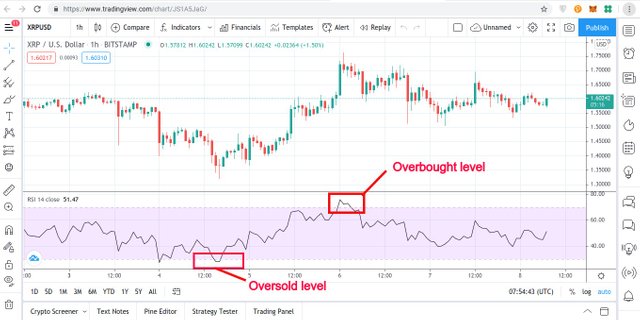
Overbought: If RSI level is above 70 level , it is considered as overbought , there is high chance that the price will retrace from there.
Oversold: If RSI level is below 30 level , it is considered as oversold , there is high chance that the price will rise from there.
Below in the image i have cleary shown the overbought and oversold levels
How do we filter RSI signals to distinguish and recognize true signals from false signals.
There are lots of other indicators, tools & tecniques , and Technical analysis which we can use along with the RSI indicator to filter out the false signals. MACD is also one of the best indicator which we can use along with the RSI to find trend of the assests. Here i am going to show you how you can use Bullish Divergence and Bearish Divergence along with the RSI indicator to get maximum benefit and identify the signal is true or false .
I am showing you how to identify false signals by using bulish and bearish divergence
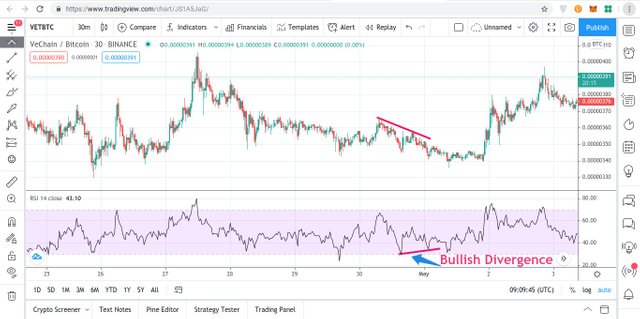
- Bullish Divergence : Here The RSI level is at 30 or lower and indicating a bullish reversal but the price is falling and making lower lows, here the signal is false. The price chart should be followed or matched by RSI indicator. If RSI is not following the price and if it is showing opposite movement, we should consider it as false signal.
On the chart you can see price is keep going down and making lower lows but the RSI is indicating bullish or reversal , it is a false signal.
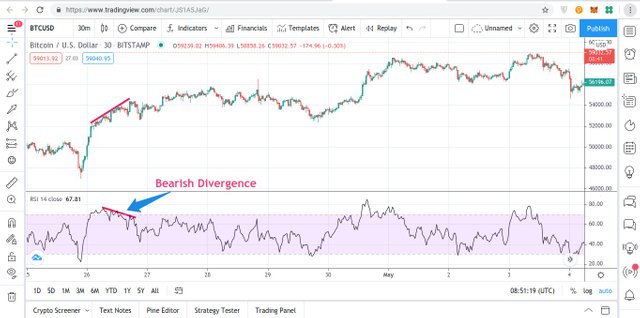
- Bearish Divergence : Here The RSI level is at 70 or above and indicating a bullish reversal but the price is moving upward and making higher highs, here the signal is false. The price chart should be followed or matched by RSI indicator. If RSI is not following the price and if it is showing opposite movement, we should consider it as false signal.
On the chart you can see price is keep moving up and making higher highs but the RSI is indicating bearish or reversal , it is a false signal.
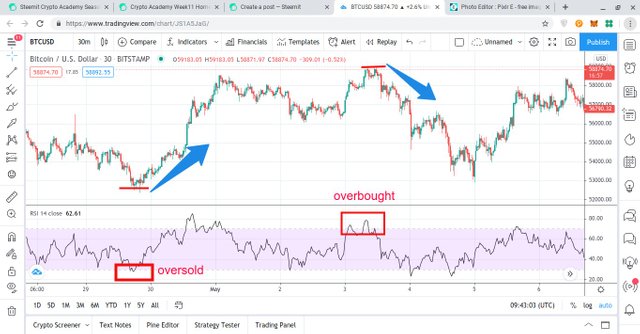
Review the chart of any pair (eg TRX / USD) and present the various signals from the RSI.
I am showing you BTCUSD pair chart in 30 minutes time frame. Image clearly showing the oversold and overbought are/zones and price reversal from that zones. Bullish divergence and bearing divergence really helps a lot in analyzing the price movement and in indentifying the correct signals.
- Conclusion : The RSI indicator really helps us in analyzing and indentifying the price movement . It helps us in indentifying the market trends. But for good result we must also use some other trading tools, techniques and indicators along with RSI. The time frame of the chart also impact on the RSI levels.
NOTE: RSI is a lagging indicator , results are shown upon calculating the past data and its is risky if we trade blindly , we cannot relay only on RSI , RSI helps the trader but all the time it maynot give accurate signals.
Thanks to the Professor @kouba01 for the lecture and clearly help us understand about The RSI Indicator, how to setup and how to use it, how to filter out false signals, i really enjoyed your all lectures where you explained all the things very clearly.
Thank you all steemians for reading !
Hello @sexualhealing,
Thank you for participating in the 4th Week Crypto Course in its second season.
Unfortunately, your post will not be voted on, because you do not have at least 100 SP in your wallet.
Professor @kouba01 , now my account have more than 100 SP. Please consider looking into my post and evaluate my post !
@steemcurator01 @steemcurator02
https://steemit.com/hive-108451/@sexualhealing/steemit-crypto-academy-season-2-week-4-or-cryptocurrency-trading-with-rsi