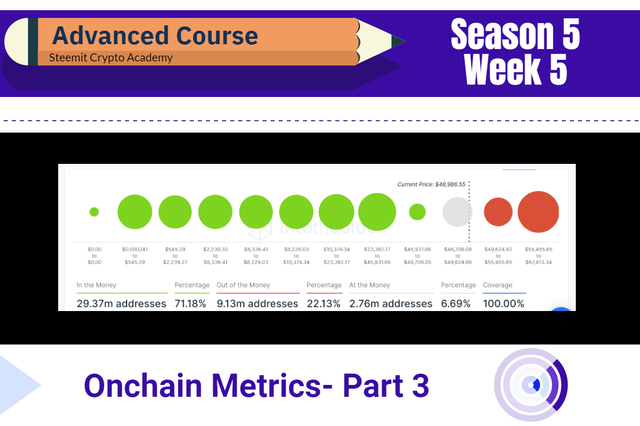
Steemit Crypto Academy Season 5 [Advanced Course] Week 5 - Onchain Metrics- Part 3

Background
A public Blockchain is an immutable, incorruptible, verifiable & auditable public ledger. Utilizing the Blockchain data one can leverage into the on-chain metrics to make it relatable to an underlying asset's price development.
The price action may be an explicit thing, but the underlying microstructure of price action always takes cues from the on-chain metrics.
In the previous season, we have already discussed different on-chain metrics: Nos of Active Addresses & Nos of Transactions, HODL Wave & Age of a coin, Exchange inflow and Outflow, NVT Ratio, MVRV Ratio, etc.. Today we will deep dive into Global In/Out of the Money, Support/Resistance based on GIOM, Momentum based on GIOM, Adjusted Large Transaction Volume, etc.
Different reliable sites for Onchain Data
The raw approach to obtain on-chain data is to run a node and extract and sample the data to identify a trend/pattern.
But since the birth of Bitcoin, we have already spent a decade in cryptos. So there are different sites/services available as of date to provide you the readymade on-chain data and novel approaches to analyze it with a proven history.
List of reliable sites for onchain data
Today we will use the IntotheBlock app for GIOM and Adjusted Large Transaction Volume on-chain metric.
(1) Global In/Out of the Money(GIOM)
It's very natural that in a dynamic global crypto ecosystem, the traders/investors are buying/selling the asset every single second, every minute, every day, etc. This also includes the exchange liquidation of assets.
Beyond the temporary noise of the chart/price action, a considerable size of HODLERS still plays a vital role in the price action of crypto assets, precisely contributing to the long-term historic bull cycle. And in an asset like Bitcoin, it is historically proven.
Global In/Out of the Money(GIOM) is a concept in which the on-chain data of the different prices are collected at which it was bought and held by the addresses, then a cluster is formed for simplification for each price range. This classification is done taking into account the number of addresses and the price range, and the volume. Based on the price range, the asset's average price in that cluster is determined.
This classification of GIOM helps to ascertain whether an address where the BTC is held is making money or losing money. Please note it confers a generic global relationship between the current price with respect to the different clusters of GIOM on-chain data; it may or may not necessarily depict the profitability for an individual.
GIOM on-chain data is an array of different clusters. Each cluster has a price range, average price of that cluster, number of address and total volume.
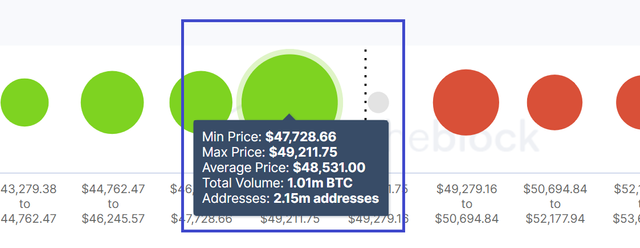
A total volume of 1.01 million BTC is held in 2.15 million addresses, with the average price being 48531 USD, with the price range- 47728 to 49211 USD.
Considering the circulating supply of 18.9 million BTC approx(from Coinmarketcap), this cluster is roughly 5.34% of the total circulating supply.
This cluster can act as both support and resistance depending on whether ITM or OTM. However, its impact as support or resistance depends on its size relative to the total volume.
The three categories of GIOM on-chain metric are:-
- In the Money
- At the Money
- Out of the Money
In the Money(ITM)
If the asset's current price is greater than the higher range of a cluster, then that cluster is said to be In the Money(ITM). The impact of that cluster is further subject to its size: the larger the size, the greater the impact as support.
At the Money(ATM)
If the asset's current price is equal to the average price of a cluster and/or falls within the range of a cluster, then that cluster is said to be At the Money(ATM).
Out of the Money(OTM)
If the asset's current price is lower than the lower range of a cluster, then that cluster is said to be Out the Money(ITM). The impact of that cluster is further subject to its size: the larger the size, the greater the impact as resistance.
.png)
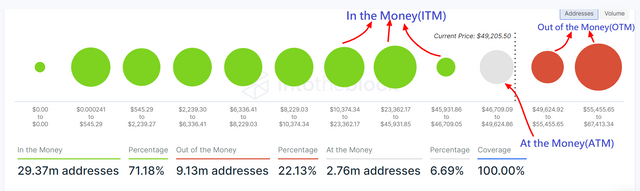
The Current Price of BTC= 49205 USD
29.37 Million Addresses(71.18%) are in the money(ITM) whereas 9.13 Million addresses(22.13%) are out of the money(OTM). 2.76 Million addresses(6.69%) are at the money(ATM).
The relative difference between ITM and OTM sets the tone of the market. If the relative percentage is ITM, it creates buying pressure and vice versa.
Using the GIOM on-chain metric, the global buying/selling pressure, the different clusters of support and resistances, the price range for trading, momentum, etc., can be ascertained.
1.1 Resistanace & Support based on GIOM
GIOM is purely an on-chain metric, and it classifies the different clusters based on the addresses and BTC held in those addresses. It is also known as the fundamental native indicator for support and resistance at any given time.
The market is a dynamic concept; therefore, the cluster and its size also change when the BTC held in an address moves out to a different one.
A cluster can act as support if it is ITM and acts as resistance if it is OTM.
Each cluster has a price range. That range helps a trader ascertain the possible areas of buy or sell, precisely the support and resistance levels.
Generally, the large-sized clusters offer significant support or resistance. Further, if it forms a confluence with the support and resistance as per TA, it adduces its role as important support or resistance.
Let's try to understand with an example:-
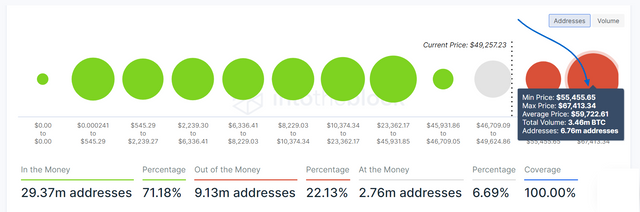
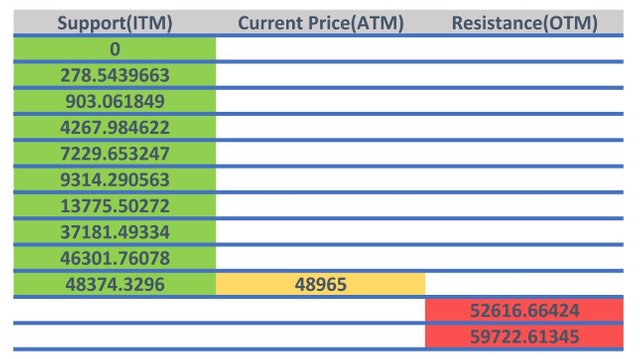
The current price of BTC is 49257 USD.
On the way up, there are two clusters:-
- Cluster 1: Avg price- 52616, 2.37m Addresses, 1.43m BTC.
- Cluster 2: Avg price- 59722, 6.76m Addresses, 3.46m BTC.
These two clusters are precisely the resistances, with the bigger one being 59722 level, 3.46 million BTC being held in 6.76m Addresses.
.png)
If BTC successfully closes above the 52616 level, then the next level of resistance for BTC will be 59722. If BTC closes above 52616 level, cluster 1 will not sell their BTC or, if it gets sold, will be equally bought and replace the cluster with a new one, perhaps a better one.
Then the next level of challenge is 59722. At this level, also a similar logic applies. However, please note that the size of this cluster is more significant than the previous one, and the total volume of BTC is also substantial, i.e., 3.46 million BTC, roughly 18.3% of the total supply.
Being a significant resistance in terms of cluster size, it will either create a significant sell pressure or will make a zone, resistance turned support, should it clear that level & close above it. If the latter comes true, then it is essential to note that the relative ITM to OTM will also significantly rise, further validating the thesis of a strong bull cycle.
At the moment, ITM vs OTM is 71.18% vs 22.13%. If BTC marches to close above 52616 and 59722 levels, the ITM will get closer to 100%. In a scenario when ITM marches closer to 100%, the asset goes for price discovery and creates ATH(All-time-high). A similar event happened earlier in 2021 when BTC started trading above 20000.
1.2 Momentum based on GIOM
The relative difference between ITM and OTM over a specified period in terms of Addresses for a given price range determines the momentum either to the upside or the downside.
If the relative difference is positive, then the momentum favors the buyers and vice versa.
Example,
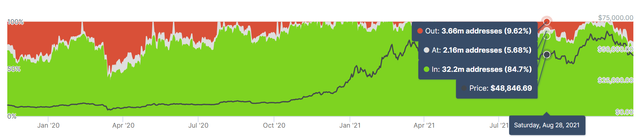
Aug 28, 2021
Price of BTC- 48,846
ITM- 32.2m Addresses(84.7%)
OTM- 3.66m Addresses(9.62%)
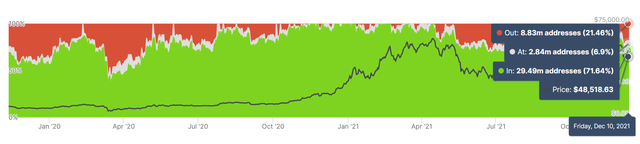
Dec 10, 2021
Price of BTC- 48,518
ITM- 29.49m Addresses(71.64%)
OTM- 8.83m Addresses(21.46%)
Please note that the price range has to be equal to determine the momentum. I have taken here the price range of 48000-49000 level.
From Aug 28th to Dec10th 2021, there has been a significant drop in the nos of addresses featuring in ITM(from 32.2m to 29.4m Addresses, accounting a drop from 84.7% to 71.64%) and there has been a rise in the nos of addresses featuring in OTM. That signifies a downside momentum for BTC. Because for the same price range over the specified period, relatively more addresses have turned OTM, indicating a build-up of momentum on the sell-side.
(2) Large Transaction Volume
Large Transaction Volume is another on-chain metric that tracks all the transactions larger than $100k. It signifies the whale's activities and/or the activities of institutional players in the market.
This indicator aggregates all the transactions larger than $100K and plots the contour as total or adjusted. The total value of such transactions(>$100k) might produce misleading or distorted results because one can use the same address multiple times for transfer and re-transfer back to the originating address. Therefore adjusted figures are considered more accurate as it filters out all the transactions returned to the originating address.
If you find spikes in the contour of Large Transaction Volume, it signifies significant interests among the whales/institutional players either on the buy/sell side. In contrast, a continuously falling contour signifies uninterested whales/institutional players in the asset and price action.
Example,
Let's take BTC chart and let's check Adjusted Large Transaction Volume of BTC.
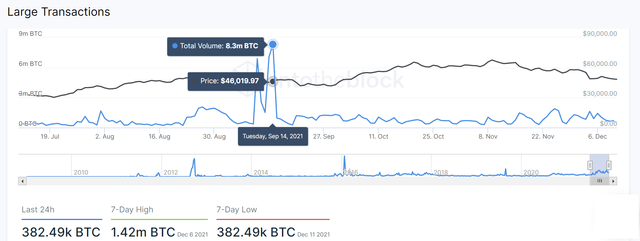
The last significant spike was 8.3m BTC at 46,019 level. The aftermath of the spike helped BTC to rally onto 69k level. Therefore we could comfortably conclude that the spike was a buying interest among institutional players. A similar spike was also observed in March 2020.
However, there has been a continuous drying up of volumes since 14th Sept 2021. The last 24h adjusted transaction vol reported 382k BTC approx. From 14th Sept 2021 till date, the adjusted large transaction volume has dried up from 8.3 million to 382k BTC, a 95% drop in institutional activities.
Analysing BTC price action using On-chain metrics: GIOM, Adjusted Large Transaction Volume, etc.
Go to intotheblock.com and register a new account. If you have already registered an account, open the App.
Alternatively, go to https://app.intotheblock.com/coin/BTC/deep-dive?group=all&chart=all
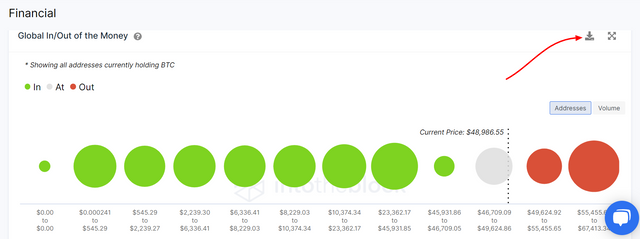
To download Global In/Out of the Money's raw data, click on the download icon.
.png)
Then using the raw data, find the total volume as a percentage of the total volume and then indicate the current price of BTC. Accordingly, identify what percentage is ITM and what percentage is OTM.
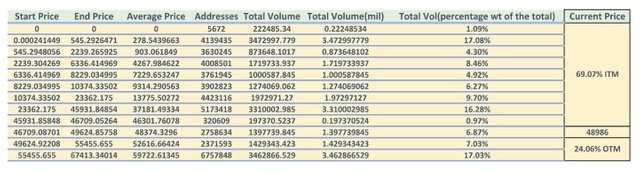
As calculated from the raw data and relative to the current price of BTC(48986), 69.07% is ITM whereas 24.06% is OTM.
Support and Resistance:-
(1) Short-term (Range 41k to 57k)
ITM- 51.25%
OTM- 48.64%
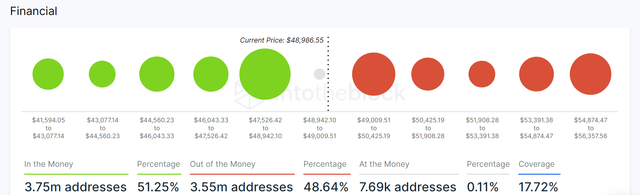
Neither Bullish nor bearish, it's trading in no-man land(indecisiveness). Generally, the traders wait for further direction before placing their bets for long or short.
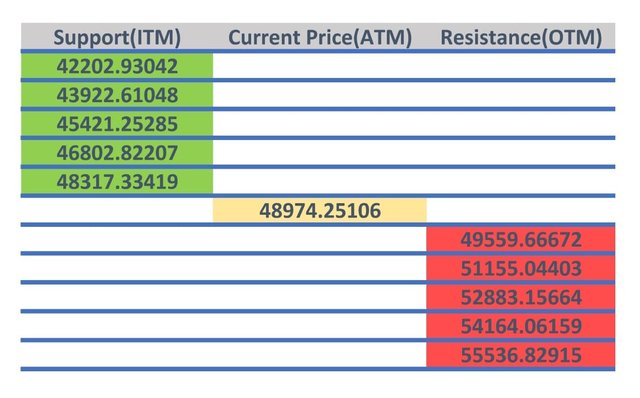
Following are the short-term support and resistance levels:-
(1) Long-term (Hostoric Level)
ITM- 71.18%
OTM- 22.13%
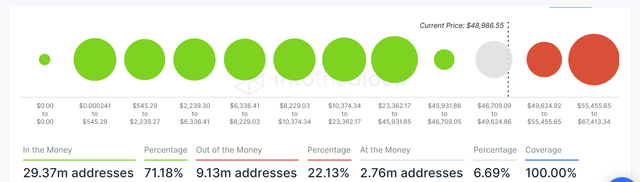
Although not in a position to go for price discovery, the ITM:OTM still suggests a long-term bullish trend for BTC as more than 70% of the addresses are in the money(ITM).
Following are the long term(historic) support and resistances:-
Momentum based on GIOM
As discussed earlier, from Aug 28th to Dec 10th 2021, there has been a significant drop in the nos of addresses featuring in ITM(from 32.2m to 29.4m Addresses, accounting a drop from 84.7% to 71.64%) and there has been a rise in the nos of addresses featuring in OTM.
So momentum is not favoring the current price action to the upside; rather, it's tilted mildly to the downside.
Adjusted Large Transaction Volume
Since 14th September 2021, the adjusted large transaction volume drying up amid a continuously falling contour, not a healthy sign for BTC bull.

The last significant spike recorded 8.3m BTC adjusted large transaction volume on 14th Sept, and the previous 7 days spike was 1.42 m BTC, an 82.89% drop in adjusted large transaction volume, not supporting a bullish BTC.
Thank you.
Homework Task (Season 5/Week-5)
(1) What do you mean by Global In/Out of the Money? How is a cluster formed? Explain ITM, ATM OTM, etc with examples?
(2) Explain about Large Transaction Volume indicator with examples? What is the difference between Total and Adjusted Large Transaction Volume?Examples?
(3) Analyze a crypto asset(other than BTC) using on-chain metric: GIOM, and Adjusted Large Transaction Volume? Ascertain whether it supports a Bullish or Bearish bias or Neutral? How do you find the support and resistance using GIOM? How do you ascertain the upside/downside momentum using GIOM? Use InTotheBlock app or any suitable app? (Examples/Screenshots)?
Guidelines
- Your article should be at least 500 words.
- It is always better to gain user experience before submitting your article.
- Refrain from spam/plagiarism. This task requires screenshot(s) of your own experience. Use images from copyright-free sources and showcase the source, if any.
- This homework task will run until 18th Dec'2021, Time- 11:59 PM UTC.
- Users with a reputation of 65 or above and a minimum SP of 900(excluding any delegated-in SP, delegating to vote-buying services is viewed negatively) are eligible to partake in this Task. (Must not be powering it down).
- #club5050 status (last one month) is a prerequisite to participating in this homework task. The minimum threshold for Club5050 is 150 SP power up in the last one month regardless of the payout and earning. This is applicable for both active and inactive users. The upper threshold is subject to your cashout and earning for the specified period(i.e. last one month). There should not be any power down history for the specified period.
- Add tag #sapwood-s5week5 #cryptoacademy in your post and should be among the first five tags. You can also use other relevant tags like #blockchain #onchainmetrics or any other relevant tag. And also make sure you post in the Steemit Crypto Academy community.
- Those who include the real examples/screenshots will score better.
- Your homework title should be Onchain Metrics Part-3 (GIOM, Adjusted Large Transaction Volume)- Steemit Crypto Academy- S5W5- Homework Post for @sapwood
Important Note:-
"If you have not had any earnings in the last one month, you will need to make a power-up of at least 150 STEEM to take part in the Academy(to validate your Club5050 status, inactive users).
This can either be from any liquid STEEM or SBDs you have, or you can buy STEEM from an exchange".
"Alternatively you can make posts outside of the Academy and wait until you have earnings from those posts to power up."
(Please feel free to join the comment section if you have any doubt on Homework-Task)
A request to Steemit Team, @steemcurator01:-
I request @steemcurator01 not to vote this Post because I could not keep up with the Club5050 status. I tried my best. But I am going through a rough patch at the moment financially. I am not trying to gain sympathy by saying this; It's not even like I don't want to be a part of Club5050. I am a strong proponent of Club5050.
But I am saying this from a different perspective. The students in the Academy should not feel discriminated (on Club5050). It is applicable for all, including professors. Therefore the sacrifice should come from the professor/MOD first. I will continue to work with utmost passion and determination in the Academy(without support, should I fail to maintain Club5050 status). I will try my best to restore my Club5050 status as I progress.
Honesty always comes from great people, and you are a true example of such great people sir sapwood. I pray 🙏 other leaders follow from your good examples
Thank you.
That's great to see our beloved professor's honesty and integrity.I am proud to be a part of community where such people exist. @sapwood 😍
Thank you.
This is a great lecture prof. And besides, I love your commitment to the endeavor and also the courage to keep doing what's right and best for the interest of all the students and the entire steemit community. No one should feel discriminated as per club5050.
You have a cogent reason and a solid point prof of which everyone should understand. I appreciate the good work. May God bless you as you dedicate your time. Thanks a great deal.
Thank you.
Hi prof @sapwood, please help me get vote from steemcurator02. My homework post for prof sachino8 has been graded for 6 days now but has received no vote and will expire tomorrow. Please help me. This is the homework post. 👇
https://steemit.com/hive-108451/@zology69/rectangle-pattern-crypto-academy-s5w4-homework-post-for-sachin08
Saludos bendiciones profesor un contenido muy educativo, ahora le envío mi tarea realizada hace 6 días para el profesor @sachino8 ya que las misma fue corregida, más no fue visitada por @steemcurator02 le dejo el enlace. Agradezco la ayuda
https://steemit.com/hive-108451/@florni/comercio-usando-patron-de-rectangulo-crypto-academy-s5w4-publicacion-de-tareas-para-sachin08
great prof, that's really something that not many others do, whatever is happening to you, I hope you recover soon or everything will be fine for the future, keep the spirit prof @sapwood
Thank you.
Sir @sapwood please check it. I am eligible for coub5050 ?
https://steemit.com/hive-108451/@zeebhutta/crypto-academy-s5w5-trading-strategy-with-the-vwap-indicator-homework-post-for-lenonmc21
Eligible
Sir @sapwood plz comment on my homework because Professor is asking i am not eligible. My hard work will be wasted.
Thanks