Steemit Crypto Academy Season 5 Week 8 [Beginner's Course] - Reading Special Bar Combinations


Introduction
Hello everyone!
First of all, A very Happy New Year to all of you. May this year bring us happiness and success.
This is my fourth lesson as a Crypto Academy Professor and I am glad that I am sharing knowledge to you all. I welcome you all to the Seventh Week of Season 5 of Steemit Crypto Academy.
This Lesson is about Reading Special Bar Combinations.
In the Previous lectures, We studied about Recognizing patterns in Trading like Triangles, Flags and Rectangles and Wedges. Now In this Lesson, We will learn about Price Bars which is important in trading.
Price Bars
When you start looking at charts, you can see what looks like a bunch of unrelated dots. It can take a little practice to see, but inside each dot of the chart lies a world of information which is very important in trading.
The "dot" is a price bar, which graphically represents all the transactions, movements done in a security, revealing supply and demand at each point.
Here in this lesson, I will explore all about price bars. If you will understand price bars perfectly, then almost nothing in technical analysis can confuse you for very long.
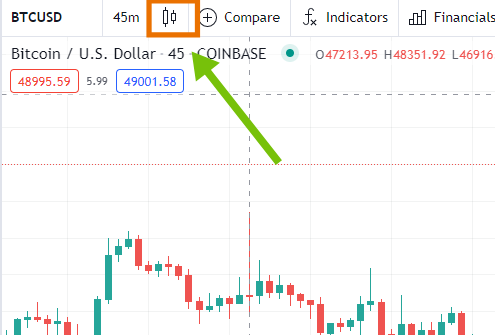
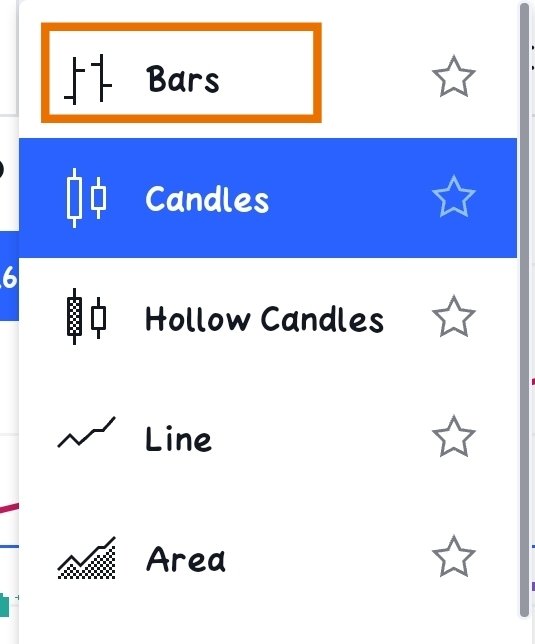
I wilk explore all about Price bars on Trading View. First of all, Go to Charts and then Click on Candles logo and Select Bars.
The Price bar can also be useful for identifying trend and critical changes in trend. Price changes daily in numerous ways. Every major trend starts with the change in price bar.
The Price bar defines the trading action in a security for a given period. A Price bar can encompass different periods - anything from a minute to month.
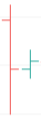
.png)
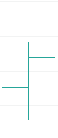
The above image is of a price bar in which I have shown some terms which are Low, High, Open and Close. I think you guys are already familiar with these terms.
Open- The little horizontal line on left is the opening price.
Close- The little horizontal line on right is the closing price.
Low- The bottom of the vertical line is the low.
High- The Top of the vertical line is the high.
Using Bars to Identify Trends
After a price is established through the execution of a trade, traders have a baseline from which to track prices. The observation of technical analysis is that the price bar embodies all the supply-demand activities of the day and that the series of bars on the chart results in the form of a trend.
Before coming to identification of trend using Price bars, I want to explain you about some terms which will help in identification of trends. I know most of you are familiar with these terms but still, I wilk explain it.
Higher High- When the today's high is higher than the yesterday's high, then it can be known as Higher high.
Higher Low- When the today's low is higher than the yesterday's low, then it can be known as Higher low.
Lower High- When the today's high is lower than the yesterday's high, then it can be known as Lower high.
Lower Low- When the today's low is lower than the yesterday's low, then it can be known as Lower low.
Now, I'll describe how to use combination of bars to identify a trend in the market.
Identifying an Uptrend
If we are seeing a series of higher highs together with higher lows, then this hints that a trend is forming. We can also understand that bulls outnumber bears.
After all, Your goal is to identify a trend and to buy near the beginning of the trend. Firstly, Look at the highs and lows of the bars and If you have two higher highs and two higher lows at Day 1 and Day 2, then Is this Uptrend? Not necessarily. Well, Prices don't move in straight lines. You will often see a series of two of three higher highs interrupted by one or two lower highs.
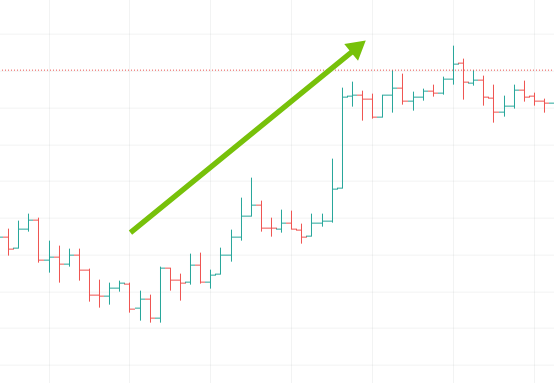
You can also see an unbroken series of higher highs on every single day. From Figure, You can see that every close is higher than the close the day before. At the same time, the price is making a fresh high nearly on many days but not everyday.
See the bar marked on the above image on Day 4, the close was higher than the open and the low was higher than the low the day before but the high of the day was not higher than the day before. Still, there is uptrend. So, We need to understand at this point that We will not see fresh higher high everyday but We will see close higher than the open and low of the day higher than the day before for identifying an Uptrend.
Identifying a Downtrend
A downtrend is a series of down-day bars which means a close which is lower than yesterday characterized by lower lows and lower highs in a preponderance of bars.
For example, Look at the downdays in the image below. After the first day, each of these bars have a close lower than the close a day before.
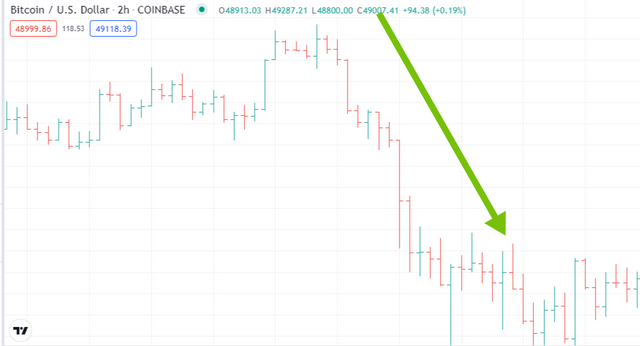
It can also be interrupted in the highs but there will be a Lower low at every next day which points to beginning of a downtrend.
When identifying a downtrend, a series of lower highs is a good confirming signal to the series of lower lows. When traders see these new lower lows everyday, then they prefer selling their assets as Traders are not willing to hold a falling asset and hence the selling pressure increases.
Reading Bar Combinations
Charts contain endless bar combinations and If you can identify a few special case, then it will be very useful as they serve as signpost to guide your interpretation of what the price is going to do next.
Just like patterns, There are also some special bar combination and If you can spot them, then it will be very useful to you as You can predict the next move of the price. In this section, You will learn about reading special bar combinations.
Closing on a High note
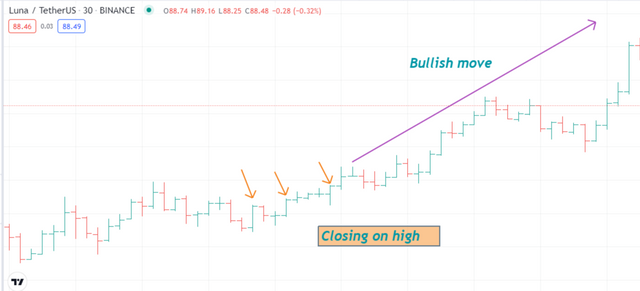
This bar combination is wildly bullish when the price closes at the high over several days. From the above image, You can see that the bar closes at high and after that, price makes a bullish move.
This indicates that the Uptrend is forming. This can be called as a move of the price if it is in the beginning days and if it makes higher high in the next days, then it indicates an uptrend is forming.
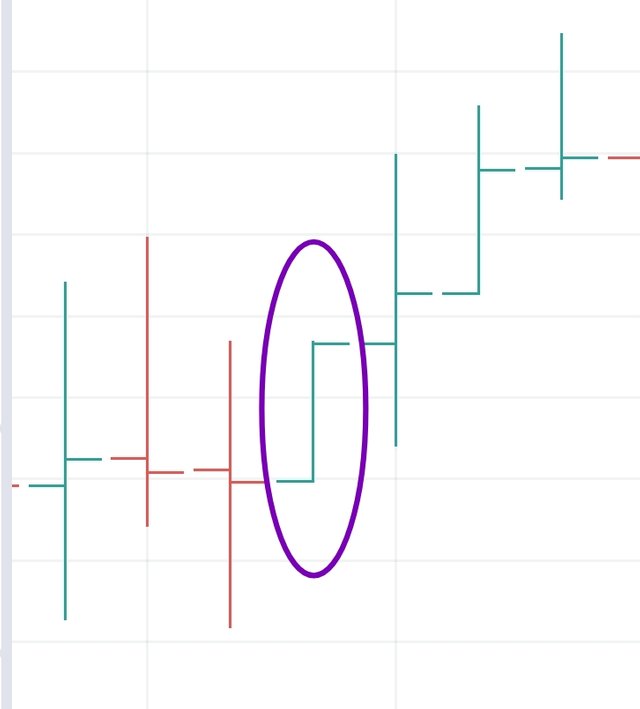
Spending the day Inside
The above image shows the inside day. An inside day refers to a price bar combination which meets these two criterias -
- The High is lower than the previous day's high.
- The Low is higher than the previous day's low.
An inside day is a bar "inside" the previous day's high-low range. It reflects indecision. Buyer's didn't feel strongly enough about this security to buy more and Sellers are not particularly inspired to sell.
The inside day doesn't suggest what's going to happen the next day. But it warns than the market is starting to reconsider what it feels about this security.
Getting outside for the day
The above images refers to the outside day. On an outside day, the high-low range of the bar is outside the range of the preceding bar. The open and close ticks can appear anywhere on the outside day bar, but two variations stand out.
The Open is at the low and the Close is at the high- This configuration suggests that something new has happened to inspire bullish buying right up to the end of the day.
The Open is at the high and the Close is at the low- You can deduce the opposite supply-demand setup here. Sentiment turns bearish here and sellers have overwhelmed buyers, right to the end of the day.
The outside day may suggest you a reversal pr continuation depending on where the open and close are and which direction the security is trending.
The outside day has a higher high by definition, but a higher close as well which implies continuation in an uptrend and reversal in downtrend, especially if the close is at the high.
Similarly, the outside day has a lower low by definition, so it confirms continuation in downtrend and reversal in an uptrend.
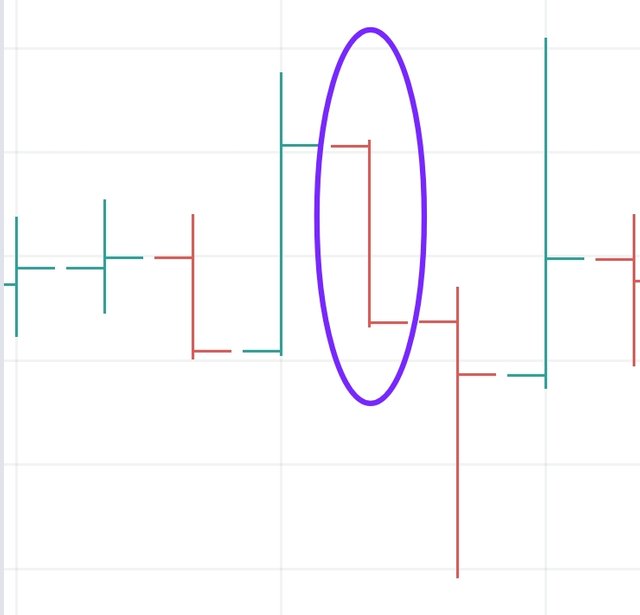
Finding the close at the open
From the above image, You can see a series of bars where the close is at the open or near the open. A close at or near the open clearly reflects indecision in the market. Now, the question arises here is whether this bar combination is signifying continuation or reversal.
However, When the open and close are at (or almost at) the same price and they are at the high or low of the day, you have a greater chance of determining whether the trend will continue or reverse.
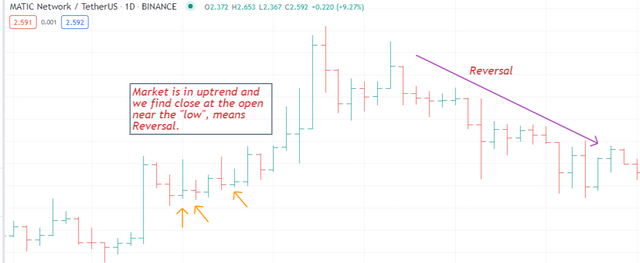
If you see this price combination in an Uptrend, then You need to look at the ticks of open and close. If the open and close are near the high, then the uptrend will possibly accelerate (continuation). If the open and close are near the low, then the uptrend will possibly reverse.
If you see this price combination in a Downtrend, then You need to look at the ticks of open and close. If the open and close are near the low, then the downtrend will possibly continue. If the open and close are near the high, then there will be a possible reversal.
Conclusion
Through this lesson, I have explained you about Reading Special Bar Combinations. There are endless bar combinations on the chart and if you are able to identify these bar combinations, then it will be very useful and beneficial for you.
Thank You for reading my lesson. If there are any error in writing, then please let me know in comments. Feel free to ask in the comment section if you have any query.
Homework Task
Make Sure you understand the lesson before performing the homework task. Also, you are required to attempt all the questions and make use of your own Crypto chart.
1- Explain Price Bars in your own words. How to add these price bars on Chart with proper screenshots?
2- How to identify trends using Price Bars. Explain for both trend. (Screenshots required)
3- Explain the Bar Combinations for Spending the Day inside for both conditions. (Screenshots required)
4- Explain the Bar Combinations for Getting outside for the Day for both conditions. (Screenshots required)
5- Explain the Bar Combinations for Finding the close at the open for both conditions in each trend. (Screenshots required)
6- Conclusion
Homework Guidelines
Homework must be posted in Steemit Crypto Academy community. Your homework title Format should be "[Your Title] - Crypto Academy / S5W8 - Homework Post for @sachin08".
Plagiarism is a great offense in Steemit Crypto Academy and it won’t be tolerated. Ensure you refrain from any form of plagiarism.
Your post should not contain less than 500 words.
All images, graphs, and screenshots from external sources should be fully referenced, and ensure to use watermark with your username on your own screenshots.
Use the tag #sachin08-s5week8, #cryptoacademy, #club5050 if eligible and your country tag among the first five tags. Also include other relevant tags like #chart, #trading #pattern.
Homework task will run till Saturday 11:59 pm January 8th UTC Time.
Only users with a minimum of 300 SP and having minimum reputation of 55 are eligible to perform this homework. Also, note that you must not be powering down.
Users who have used upvote tools to gain SP or build their reputation are not eligible for this homework.
To take part in the Academy you must have powered up a minimum of 150 STEEM in the past month for #club5050 eligibility.
Note - You can only drop your homework link in the comment section if not reviewed after 48 hours.
Cc:-
@steemitblog
@steemcurator01
@steemcurator02
Hi prof. @sachin08. I'm leaving the new link of my graded post that is not having a vote yet. Thank you in advance and wish you a nice week in this opportunity:
https://steemit.com/hive-108451/@alegnita/re-repost-estudio-de-patrones-de-cuna-crypto-academy-s5w5-homework-post-for-sachin08
Thank you for this wonderful lecture professor. I hope to submit my assignment in due time.
Please sir, my last assignment graded by you has still not been voted. I would be grateful if you could look into it. Here is my reposted link.
https://steemit.com/hive-108451/@rosita-nkefor/5prvju-repost-trading-using-wedge-pattern-crypto-academy-s5w5-homework-post-for-sachin08
Thank you very much.
ok
This is a wonderful one prof.
What's Your discord name professor?
Hello professor @sachin08, please while I was going through the lecture, I had some misunderstanding of the word you have used to explain the chart. "If the open and close are near the high, then the uptrend will possibly accelerate (continuation). If the open and close are near the low, then the uptrend will possibly reverse".
"If the open and close are near the low, then the downtrend will possibly continue. If the open and close are near the high, then there will be a possible reversal."
Please put more light on this for me. Thank you.
In an uptrend, you have to look at the position of open and close at their respective high or low. As it will define their Continuation or reversal. Same with downtrend.
Ok Prof. Thanks
This is a wonderful one prof. Please my entry is coming soon
Thank you professor
This is my entry
https://steemit.com/hive-108451/@sonofremi/crypto-academy-s5w8-homework-post-for-sachin08-reading-special-bar-combinations
This post pays out tomorrow and hasn't been curated till now, please intervene professor
Good day prof.
Below is my entry;
https://steemit.com/hive-108451/@ezege11/reading-special-bar-combinations-steemit-crypto-academy-s5w8-homework-post-for-sachin08
This is my entry
https://steemit.com/hive-108451/@kenneth00/steemit-crypto-academy-season-5-beginner-course-reading-special-bar-combinations
Hello Prof. @sachin08, when did adding pictures on a post after the deadline became a criteria for homework task disqualification?
I feel like this justification is beyond your task guidelines or rules.