CRYPTO ACADEMY/SEASON 3/ WEEK 2-HOMEWORK POST FOR PROFESSOR @yohan2on TRADING WITH THE FIBONACCI RETRACEMENT LEVELS BY @ruthjoe
Hello steemians,
Am delighted to be here and to join this weeks lectures. Its been good learning new things here on @cryptoacademy. Thank you prof @yohan2on for the lectures. Am here to do the home work that follows afterward.

QUESTION 1: What is fibonacci Retracement levels?
Fibonacci retracement levels are lines which are horizontal drawn on a chart specifically used for the indication of where a support and resistance will take place.
Fibonacci retracement helps traders draw support lines to get their resistant level, and to know when to place their stop loss. Therfore it is a very important tool for traders.
Fibonacci retracement produce a better result when used with other tools like moving avarages, Rsi and the rest.
A fibonacci retracement when the two ends of a chart usually the peak and tough are dividing a distance vertical in nature by some major fibonacci ratios such as 23.6%, 38.2%, 61.8% and 100%. While 50% is just an addition.
FIBONACCI RATIO'S
Fibonacci ratio can nit be talked about without mentioning the fibonacci numbers or series.
Fibonacci numbers or series includes 0,1,1,2,3,5,8,13,21,34,55,98, 144 etc
Each of this numbers are gotten by adding the two numbers in front of it.
Example : 0+1= 1,
1+1= 2
1+2=3
Etc
The fibonacci ratio are ; 23.6%,38.2%,61.8%,78.6%.
Although, traders love 50% but it is important to note that it is not a part of the fibonacci ratio. Why? It can not be gotten from the fibonacci numbers or series.
QUESTION 1B : Practically demonstrate your understanding of fibonacci retracement levels using a cryptotrading chart of your choice( use trading view)
Here is what i basically look out for in your work:
Interpretation of the information on the chart in relation to trading with the fibonacci
How you plot the fibonacci retracement levels on chart
Your entry and exist strategy( price action and retracement levels)
Trade management
Other indicators used while trading with the fibonacci retracement
Screenshots used
A retracement can be seen as a short term price correction during an over all larger upward or downwards movement. It is important to note that retracement do not indicate change in the direction of the larger trend. Therefore, the main benefit of traders trading retracement is that it provide them the opportunities to profit, by entering a a trade at the original position of the trend.
How to plot the fibonacci retracement levels on the chart
First thing to do is to add the fibonacci retracement with the following steps
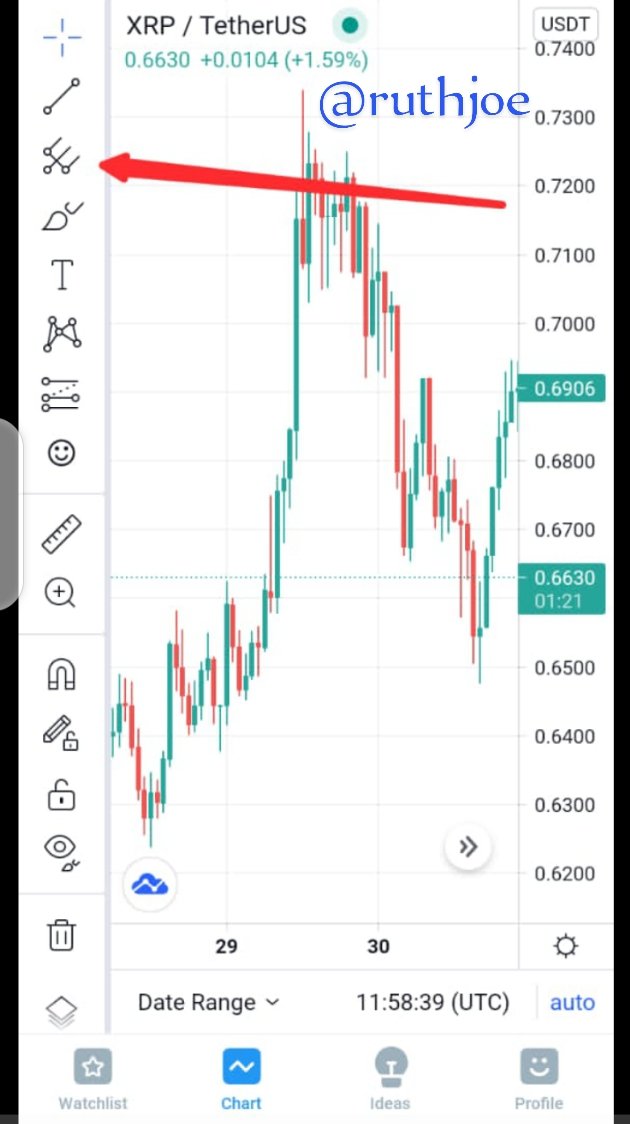
- Step 1 on my trading view app beneath it i clicked on chart.
- step 2 : As it opens up, i Located the symbol of the fork and clicked on it as seen on the screenshot below
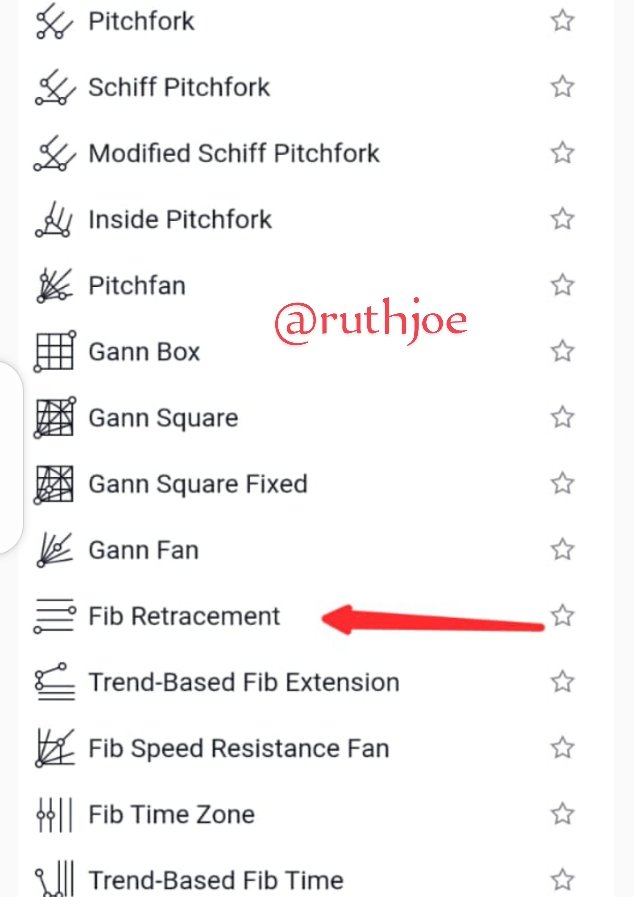
- Step 3 : I scrolled down to locate fib retracement, and clicked on it as seen on screenshot below.
Find a strong upwards and downwards trend.
For an uptrend, after the impulsive move upwards, u will want a pull back to occur, then buy back for an uptrend and sell rallies forva down trend.
Identify the swing high(the highest point price rallies too) and swing lows ( the lowest point price falls down to) to the overall trend like buy or sell.
Using the fibonacci i drew from swing high to swing low.
For a buy trend 0-100 swing high to swing low
For a sell trend 100-0 swing high to swing low
Its important to note that most popular fibonacci levels used are 61.8% levels, 50%. Fibonacci mostly works in support and resistance.
Chart for BTC/USDT pair
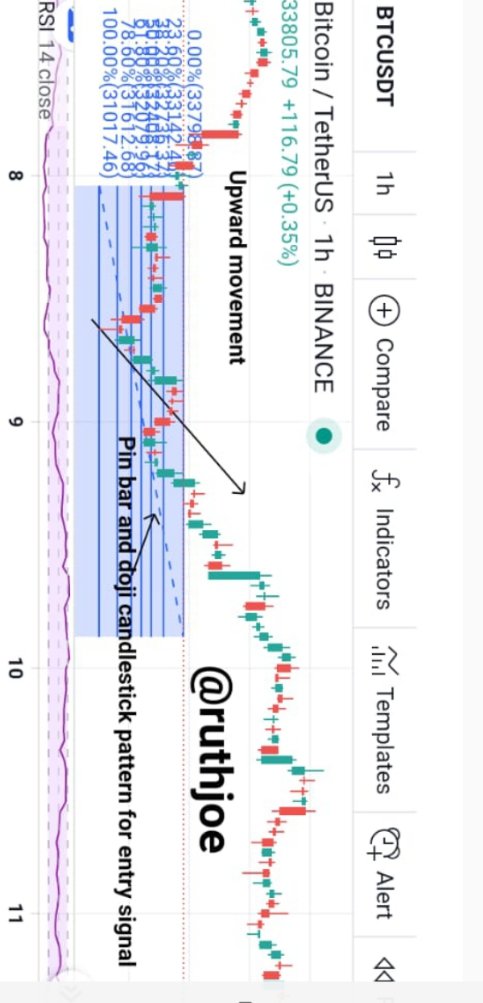
From the chart above , after price rallies up, i wait for a pull back , then i pick my fibonacci tool and place it from swing high to swing low.
Then i wait for possible reactions at levels 50%, 61.8% or even 38.2% levels .
And notice we see a doji and a pin bar around the 50% and 38.2% region, which is a strong indication for price reversal. Then i can peacefully bride the trend upwards.
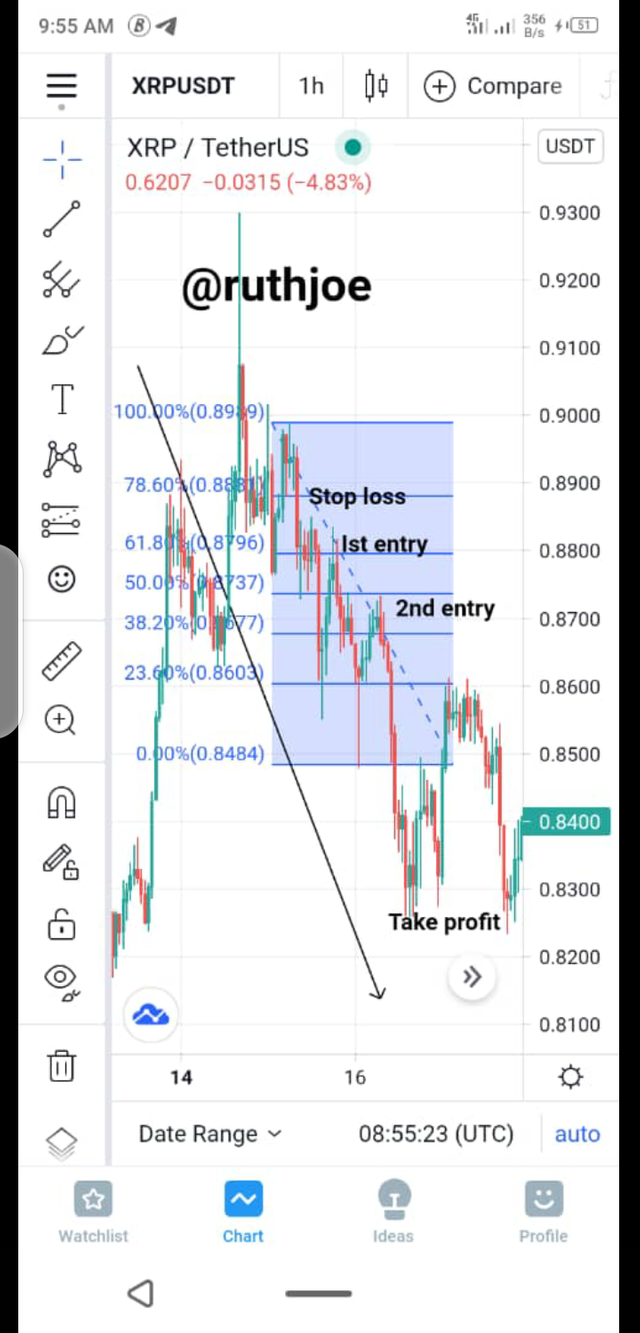
Chart for XRP/USDT pair.
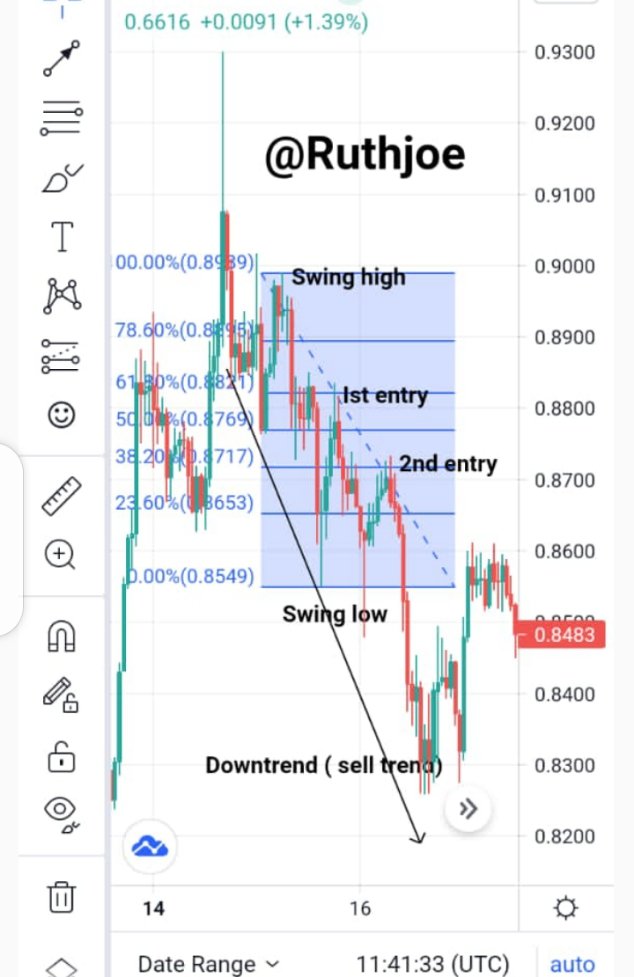
From the chart above, this is a downwards trend, so i waited for first impulsive move and wait for pull back, i place the fibonacci retracement from swing high to swing low( 100-0) and wait for possible reaction at the 50% levels or 61.8% levels or 38.2% levels. As you can see in the chart above, our first entry was at 61.8% while the second entry was at 38.2%
ENTRY STRATEGY
My entry strategy was to wait for possible reaction at those important fibonacci levels 50% 61.8%, 38.2%.
I waited to see candle stick reversal pattern to appear on those important fibonacci levels like doji, pin bars, bullish, engulfing candles, bearish engulfing candles.
EXIST STRATEGY
I looked for a place where to place my stop loss and take profit region will be at possible resistance and support levels.
For an upward trend, stop loss is placed above the resistance level.
For a downtrend, stop loss is placed above support level
TRADE MANAGEMENT
The fibonacci helps me to know the possible region for me to place stop loss or take profit.
If price moves behind the 50% or 61.8% levels, it may signify that the trend reversal wants to happen which is an opportunity for me to close position in profit or loss and switch the fibonacci to the opposite direction and wait fir a pull back to fibinacci levels and also wait for possible reactions before taking any trade.
OTHER INDICATORS USED
Other indicators that can be used are the Rsi, stochastics, moving averages, ichimoko but for the above trade i used the Rsi to support fibonacci tool.
CONCLUSION
The fibonacci retracement is an amazing tool but for effective result it should be used with other helpful tools. Traders whi have gained mastery with this tool are always smiling.
Its been amazing learning about it now.
Thank you
Hi @ruthjoe
Thanks for participating in the Steemit Crypto Academy
Feedback
This is good work. You correctly plotted the Fibonacci retracement levels on the charts and brought in the vital element of trade management. I also like the fact that you talked about price action at those levels(the dojis, bullish engulfing....etc) those indeed act as your entry triggers for your trades.
Homework task
7
Thanks for your review sir!