Repost-Understanding Trends- Crypto Academy / S5W1- Homework Post for @reminiscence01.
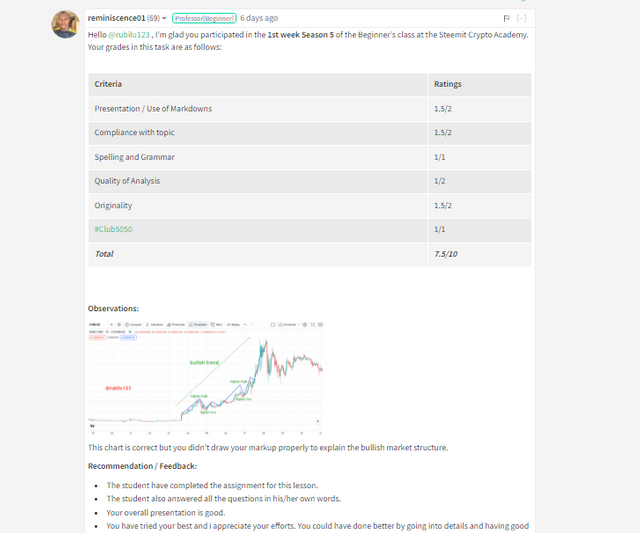
Introduction
This week professor @reminiscene01 has introduced us to the market structure. Particularly on how to read trends to take advantage when entering and exiting the market. After going through his lecture I will now submit my homework task.

Before I begin I will like to explain the concept of trading.
Trading of cryptocurrencies involves buying cryptocurrencies at a cheap price or when it is low and selling or holding till one makes profit.
Trading as we all know it has different types to a crypto currency trader. Whiles some traders use advanced tools and devices to make predictions, some other traders are simply new into the market so they trade on impulse. This means they go with their guts and this sometimes results in them having bad results. Don't get me wrong here am not saying that when a trader makes technical analysis it is sure that he will come out of the market in profit but the probability of him coming out with a loss is low.
Now let's answer the questions given by the professor.
1)a)What do you understand by a Trending market?
In simple English terms a trend can be described as a path or direction by which something is following. In our day to day activities we hear people talk of trends; which means something that is happening currently which everyone is following suite so we mostly hear of statements like she or he is following the new trend. Whether positive or negative everyone wants to hop on it because that's the new trend in town.
This can be used to relate to the crypto currency market. A trending market can be described as a point where the price of an asset is moving towards. This price movement can be downwards or upwards, it is still known as a trending market. This means that in the cryptocurrency market, there is always a trend. A bearish market is referred to as a downward trend whiles a bullish trend is referred to as an upward trend. This are the two trends in the crypto market.
The cryptocurrency market is considered to be volatile because the prices of an asset can shoot up or down at anytime but some times the trending market can be controlled by traders. By traders I mean those who buy and those who sell cryptocurrency. When the market is in an uptrend it is considered that the buyers are gaining momentum in the market than the sellers and when in a downtrend it is considered that the sellers are gaining more momentum in the market.
b) What is a bullish and a bearish trend? (screenshot required)
In the previous question above I said there are 2 types of trend known as the upward trend and the downward trend. The upward trend is what the referred to as the bullish trend. When the price of the asset is rising for a particular period of time we say the market is in its bullish trend. A bullish trend can be described as the price of an asset forming new higher highs and forming new higher lows as the price of the asset is in an upward movement.
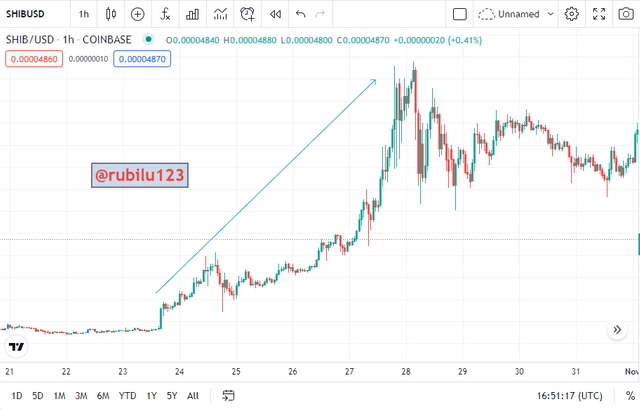
A bullish trend
After explaining what a bullish trend is, let's talk about the bearish trend. A bearish trend is the downward movement of the price of an asset to form lower lows and lower highs. In this type of trend the price of an asset is either falling from a recent spike in price of is still falling.
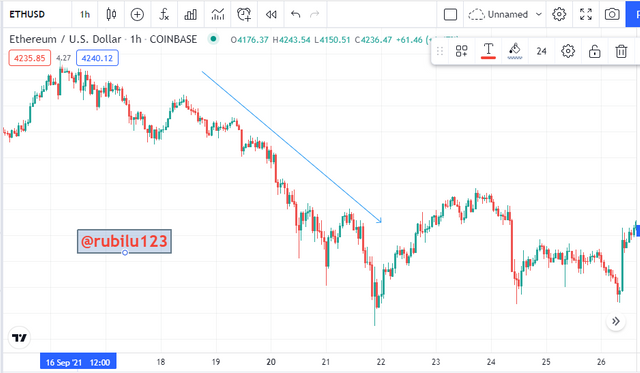
a bearish trend
2)Explain the following trend identification and give an example of each of them. (Original screenshot needed from your chart). Do this for a bullish and a bearish trend. (Original screenshot needed from your chart). Do this for a bullish and a bearish trend.i Market Structure.ii)Trendlines
Market structure can be described as the phase or trend the market is at currently. As we have stated already trends are responsible for determining the upward movement and downwards movements of an assets price. The marker structure generally talks about If the market is in uptrend, downtrend or ranging; what I normally refer to as being in-between uptrend and downtrend.
Now I will describe the market structure for both bullish trend and bearish trend.
Market structure for bullish trend
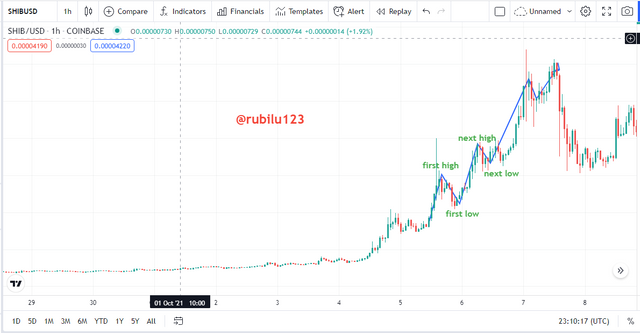
If the market is moving upwards or the price is rising we refer to this as the market being bullish. In a bullish trend, the price of the asset in question should be making a clear upward movement. In this state it will be forming higher-highs and higher-lows. The higher-highs and higher-lows formed are new higher-highs and higher-lows being formed and therefore they should be higher than the previous high and also higher than the previous low. When this does not happen and you notice a break in trend you should realize that the strength of the trend is not strong enough thus it might not be reliable and a possible trend market reversal could occur at anytime.
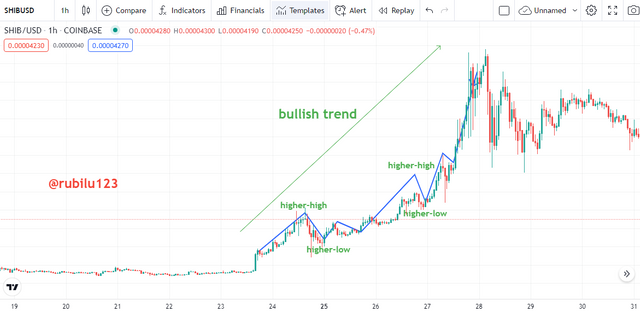
market structure for bullish trend
Market structure for bearish trend
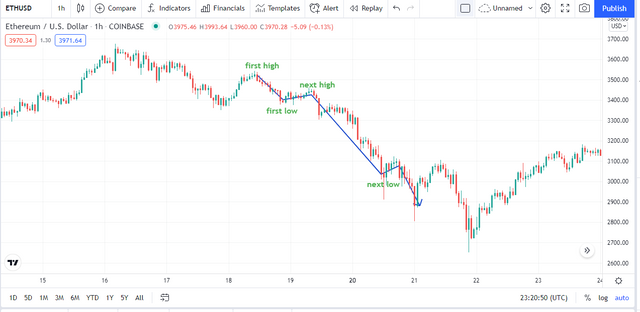
When the market is in a downward movement we refer to this as the market bring bearish. In a bearish trend the price of the asset should be in a clear movement downwards. This means new lower-highs and lower-lows will be formed. The new high should be definitely lower than the previous high and the new low should be lower than the previous low. This confirms the bearish trend. As in a bullish trend when you notice that the new high is not lower than the previous high and the new low is not lower than the previous low it means there might be distortion in the trend hence a trend reversal could be seen.
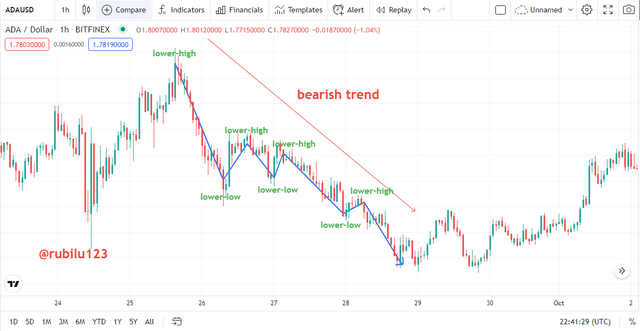
market structure for bearish trend
Market structure for ranging market
We have looked at the bullish trend and the bearish trend and we have to know that the market is not always in an upward or downwards movement it is sometimes in a ranging market. As I explained earlier, a ranging market is in-between the two markets. This means the market is between the bullish trend structure and bearish trend structure. A ranging market usually occurs when the price of the asset doesn't really know if its rising or falling because it rises at a short period of time and falls for a period of time making the marker in-between.
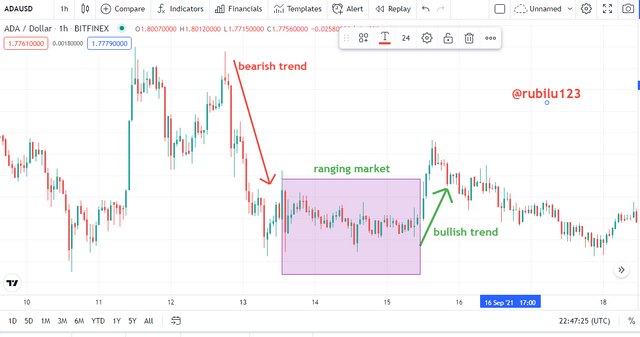
market structure for ranging market
Using a trend line is a great way of taking positions in the market. A trader who uses trend lines in taking positions study the behavior of the chart by using the trend lines.
In an uptrend market, the price of the asset in question is supposed to be rising so the trend line is placed as a point of support . When the price of the asset touches or reaches the trend line it takes support at that point and continue to rise. In case the opposite happens and the line is broken it is time to exit the market cause it is anticipated that from there onwards the trader cannot take profit thus it is best to exit the market.
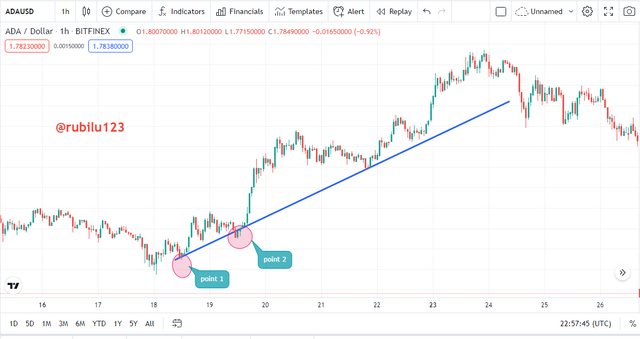
bullish trend line
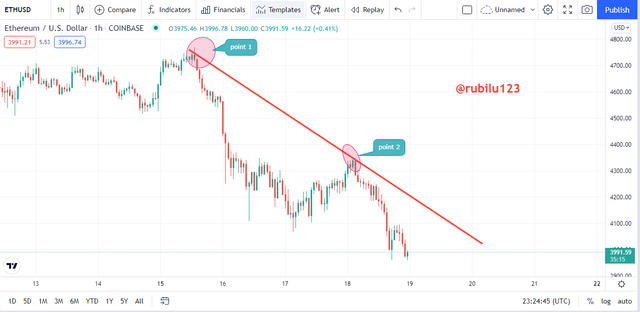
In a downtrend market, the price of the asset in question is supposed to be falling so the trend line is used as a point of resistance. So when the price of the asset touches the line which in this case acts as point of resistance, the price is supposed to fall right back at resistance and continue in its downward motion. We can maintain our position as long as at resistance the price doesn't break out and rise. When resistance is finally broken a trader can now enter the market.
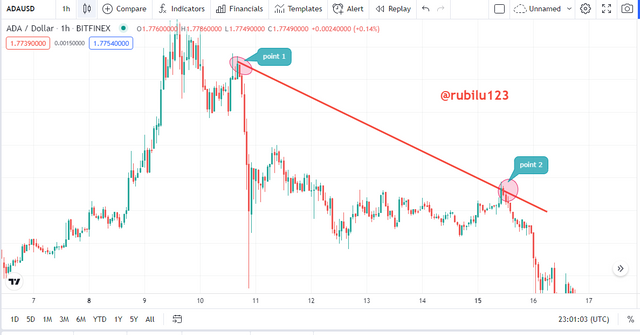
bearish trend line
NB: Even though trend lines are used to confirm entry and exit in the market, it is not advisable to take only this tool as guidance when in the market but the trader should use other technical tools as a guide with trend lines
3)Explain trend continuation and how to spot them using market structure and trendlines. (Screenshot needed). Do this for both bullish and bearish trends.
Every trader in the market will wish that the price of the asset will continue to rise but it is not possible as at some points the price will experience fluctuations and some falls. The fluctuations in the price does not mean the rice will continue to rise forever or the price will continue to fall forever. This is just a time that the assets price test important levels to see what will happen next. Now lets look at the patterns for the bullish trend and the bearish trend.
Bullish trend continuation pattern
We have spoken about what comprises of a bullish trend and the features that will make a bullish trend continue in an upward motion. We know that for a bullish trend to continue in an upward motion or for it to be valid, the higher-highs being formed must be higher than the previous high formed . This is essential for an uptrend to continue so we know that if the previous high is higher than the new high then the bullish trend is not valid.
The other valid point for a bullish trend is that the new low must be higher than the previous low. as long as we keep on with a bullish trend it is worth noting that the new higher-low formed should always be higher than the previous low thus the trend is valid. If incase the new higher-low is lower than the previous low then the trend is not valid thus a reversal is expected. It is expected that in a bullish trend traders are looking for the best time to exit the market and take profits.
In the case of the trend lines we have stated that the line acts as a support for the price and as long as the line is not broken the bullish trend is intact but if the line is broken a rise reversal is expected. Trend continuation is anticipated if the resistance is not broken.

Bearish trend continuation pattern
It is expected that in a bearish trend traders are looking for the best way to make entry into the market, so as the prices fall traders who could not get the chance to enter the market when it was in an uptrend take that opportunity and enter the market. For the bearish trend the following factors. The new lower-lows formed must be lower than the previous low formed. If the new low is higher than the previous low the bearish trend is not valid. Also the new high formed must be lower than the previous high formed. This also means that if the rule is violated then the trend is expected to be reversed.
In a bearish trend, the support is always tested by the rice and when it is broken a price reversal is then expected.
In the case of the trend lines, the line acts as resistance for the price of the asset and as long as the line or resistance is not broken the bearish trend will continue. If the price breaches the resistance then a price reversal is certainly expected.
4) Pick up any crypto-asset chart and answer the following questions -
i)Is the market trending?
In this question, I will consider the SHIB/USD pair. I will be looking at it's daily chart. Last month we saw the price of shiba breaking its resistance and the making upwards movement. Experienced traders at the time it was in a bearish trend took advantage and entered the market as they were ready to take profit when its starts spiking. In the middle of last month it broke resistance and was able to form new prices including getting to its all time high. I will say it was just a matter of time before it tests its support and try to see if it can continue to move in an upwards direction but unfortunately as of today the shiba is not in an uptrend but it is in a downward movement which is known as the downtrend.
ii) What is the current market trend? (Use the chart to back up your answers).
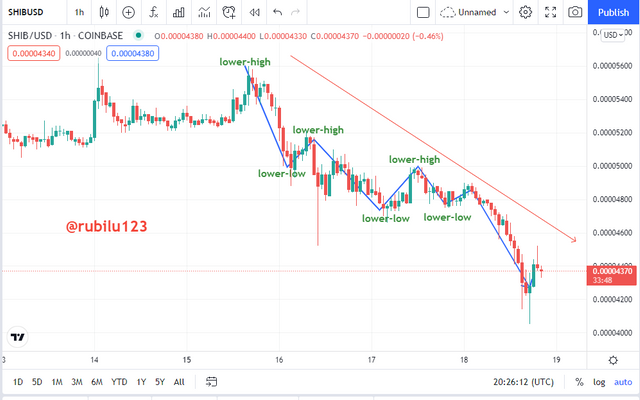
As I explained before, the market was booming and am sure most trader and holders of the asset started exiting the market with the profits they made so it is expected that the assets price will fall. This means that the sellers over shadowed the buyers in the market thus a reversal occurred. The market price is showing lower-lows being formed which are lower than the previous low and highs formed which are also lower than the previous high.
The market is currently in a downward movement and it is yet to test the resistance and then we will see if the price can breakout but for now it is in a downtrend. This is actually a good time for traders who are looking for an entry point as the price of the accent is cheap as compared to last month. Even though the trend lines and market pattern are saying its a good time, it is not advisable for a trader to use only these tools to make his decision but he should also employ the use of other technical tools.
Conclusion
The use of technical tools is always advised for traders so that they do not make decisions without thinking or without having a plan when entering or exiting the market. The trend is a great way of knowing when the market is in an uptrend, downtrend or ranging and as all other indicators or analysis it is not 100% reliable so it is highly recommended that along with the trend analysis, a different or other indicators should be used in confirming before any other decisions are made.
In this lesson I have been able to learn that a bullish trend is expected to continue upwards if the higher-highs formed are always higher than the previous high and then the higher-lows should always be higher than the previous lows. Any contradiction in this will most definitely mean that a reversal is expected. I have also learnt about the ranging market where the market is not in an uptrend nor downtrend but is stuck between the 2.
This has been an enjoyable lecture, thanks for reading.
NB- All screenshots have been taken from trading view
Link to my original post