Reading Special Bar Combinations - Crypto Academy / S5W8 - Homework Post for @sachin08
Hello steemian ...
This is my new post in the Steemit Crypto Academy community, on this season 5 week 8, I will be working on a homework from professor @sachin08 with the theme "Reading Special Bar Combinations”.

we will discuss it through the homework below:

1.) Explain Price Bars in your own words. How to add these price bars on Chart with proper screenshots?
When we want to trade, we see the rise and fall of the market price. Usually to see the increase and decrease in prices in the market is presented through a graph. Most of the traders use charts with the appearance of a candle or commonly referred to as a candlestick. As in the image below.
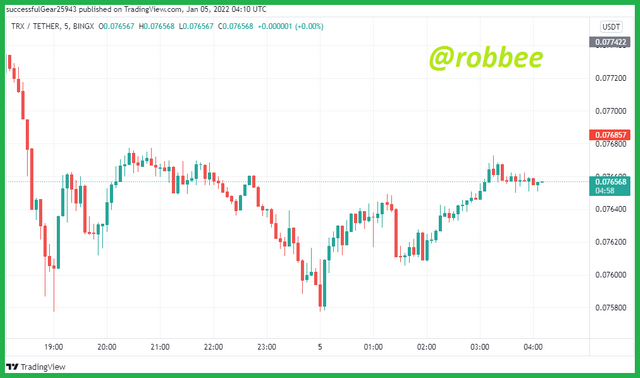
In the candlestick above we can find out 4 pieces of information on the market in each selected timeframe. We can find out the open, close, high, and low prices on the selected timeframe. Actually, for the display of a market chart, it is not only candlesticks but there are many choices of chart views that you can choose according to your wishes. But here I only focus on using chart bars as a discussion. If candlesticks are widely used by Asians, price bars are more often used by Americans for the reason that price bars are easier and simpler. To discuss further, I will show you the appearance of price bars and how to use price bars on the tradingview platform.
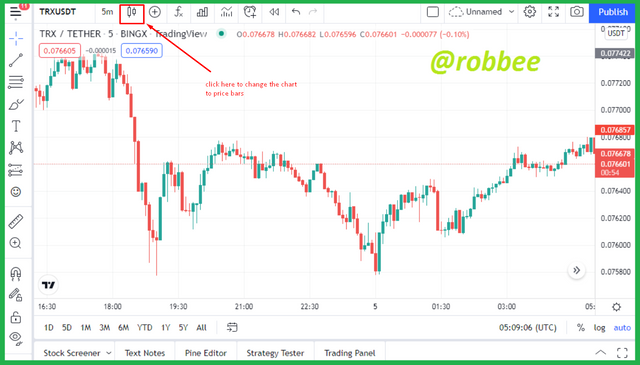
As we can see above, the chart display still uses candlesticks, to turn them into push bars like in the picture above.
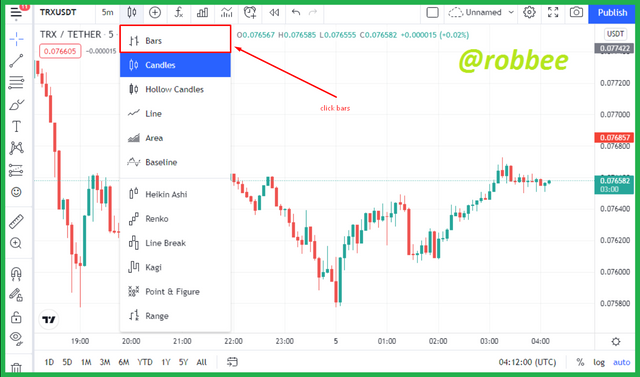
As we can see in the picture above that many chart views can be used, to select price bars, we press on Bars as in the picture above.
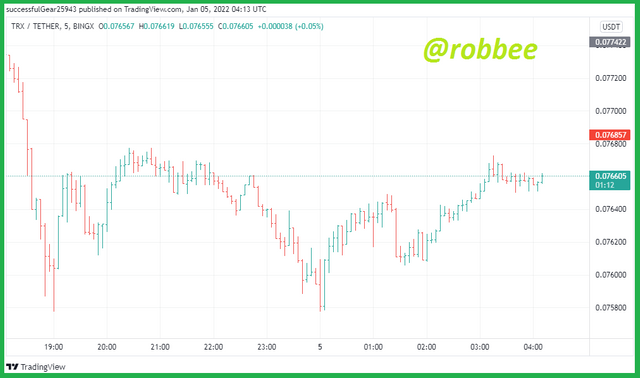
That way we can see the appearance of the chart has changed from the beginning of the candlestick to now being a bar.
As we can see that the price bar display is simpler than the candlestick display. Why do I say that price bars are easier and simpler? This is because price bars only have an open-high-low-close (OHLC) pattern, while candlesticks have other patterns from OHLC such as hammers, morning stars, and others. I think reading OHLC on price bars is easier, to read it can be seen in the image below.
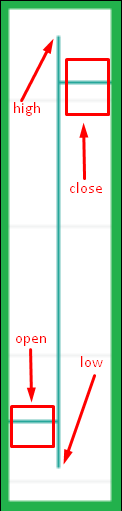
- Open on the price bars is the horizontal line to the left of the vertical line
- High on price bars is the highest vertical line on price bars
- Low on price bars is the lowest vertical line on price bars
- Close on price bars is the right horizontal line on the vertical line
2.) How to identify trends using Price Bars. Explain for both trend. (Screenshots required)
To identify a trend in the market, we must understand 4 terms to be able to identify a trend, these four terms can be used on candlesticks, price bars, and others. The four terms are:
- Higher high, formed when the new high is higher than the previous high.
- Higher low, formed when the new low is higher than the previous high.
- Lower high, formed when the new high is lower than the previous high.
- Lower low, formed when the new low is lower than the previous low.
By knowing the four terms above, we can identify trends using price bars. The way to identify a bullish trend or a bearish trend is different, therefore I will explain the two ways to identify the two trends.
To identify an uptrend using price bars, you must fulfill 2 things in the terms above. An uptrend occurs when the new high is higher than the previous high and the new low is higher than the previous low. If both of these are present in the market, the market is in an uptrend. Our goal is to identify an uptrend, of course, to do a buy entry at the beginning of the trend to get a profit. More details can be seen in the example of the uptrend in the image below.
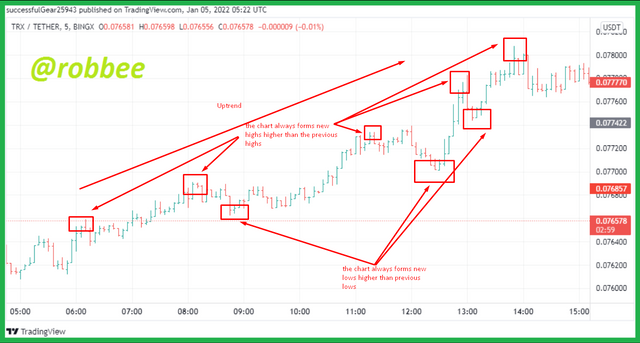
As can be seen in the picture above, that the price always forms a new high that is higher than the previous high and a new low that is higher than the previous low which indicates an uptrend in the market. As we know that the chart will not always go up and there will certainly be a decline even in an uptrend, the uptrend will continue as long as the closing price is higher than the opening price and the new low is higher than the previous low, if the market goes down and both of these is still formed, then the market will still experience an uptrend. The market condition will stop in an uptrend if there is a market condition that is unable to form a higher price higher than the previous high, which indicates the uptrend will end soon.
To identify a downtrend using price bars, you must fulfill 2 other things in the terms above. A downtrend occurs when the new high is lower than the previous high and the new low is lower than the previous low. If both of these are present in the market, the market is in a downtrend. Our goal is to identify a downtrend, of course, to make a sell entry at the beginning of the trend to make a profit. More details can be seen in the example of the downtrend in the image below.
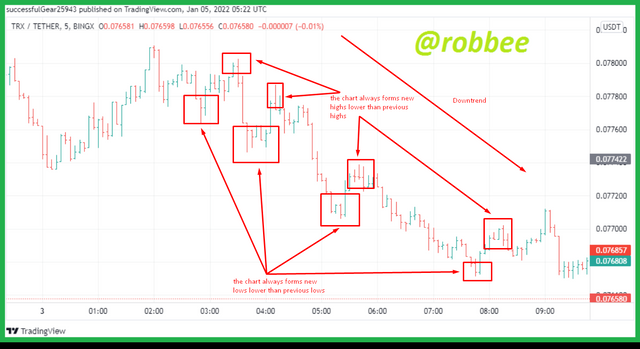
As can be seen in the picture above, that the price always forms a new high that is lower than the previous high and a new low that is lower than the previous low which indicates a downtrend in the market. As we know that the chart will not always go down and there will certainly be an increase even in a downtrend, the downtrend will continue as long as the closing price is lower than the opening price and the new high is lower than the previous high, if the market goes up and both of these is still formed, then the market will still experience a downtrend. The market will stop in a downtrend if there is a market condition that is unable to form a new lowest price lower than the previous low, which indicates the downtrend will end soon.
3.) Explain the Bar Combinations for Spending the Day inside for both conditions. (Screenshots required)
Combinations for spending the day inside is a combination of the time of changing bars where the combination must be two bars of different colors, for spending the day inside must meet two criteria, if the two criteria are formed then spending the day inside is formed, both these criteria are:
- The price of the new high bar is lower than the price of the previous high bar.
- The price of the new low of bars is higher than the price of the previous low of bars.
Spending the day inside is formed due to doubts between buyers and sellers in transactions, buyers are afraid to make large purchases and sellers do not want to make sales which causes spending the day inside to form. Spending the day inside there are two conditions, the condition of the red bars is greater than green and the condition of the green bars is greater than red.
If spending the day inside is formed, we also cannot conclude that the trend will go up or down. But after I observe the market, I can draw some conclusions. If spending the day inside is formed with the red bars being longer than the green bars, there is a high probability that the graph will go up, as in the picture below.
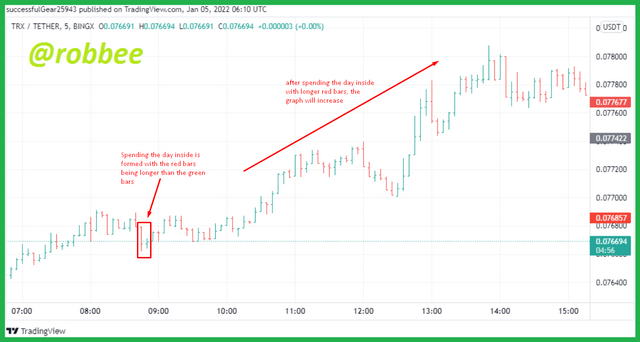
As can be seen when spending the day inside is formed with the red bars being longer than green then the graph increases, although sometimes the graph may go down when spending the day inside is formed, but has a larger percentage that will rise. To be clearer, it is better to use indicators to clarify the results.
If spending the day inside is formed with the green bars being greater than the red bars, the percentage is greater, the graph will likely go down as shown in the image below.
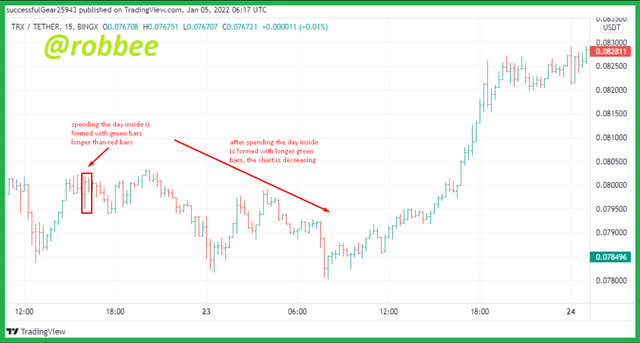
As we can see, after spending the day inside is formed with bigger green bars, the graph has decreased. Although it has another possibility when bigger green bars form then the chart goes up. After what I observed the percentage of the chart fell more often if spending the day inside with larger green bars was formed, therefore we should use the help of indicators to get better results.
4.) Explain the Bar Combinations for Getting outside for the Day for both conditions. (Screenshots required)
Using bar combinations for getting outside for the day allows us to know the direction of the trend that will occur. There are two variations of getting outside for the day, each variation has different requirements and different signals. The two variations are:
- The first variation occurs when the open price is at the lowest price and the close price is at the highest price, meaning the bar is up, and at that time all traders make purchases.
- The second variation occurs when the open price is at the highest price and the close price is at the lowest price, meaning that the bar is in a downward state and at that time all traders are selling.
Both variations indicate that the trend will continue and the trend will reverse. For more details, see the image below.
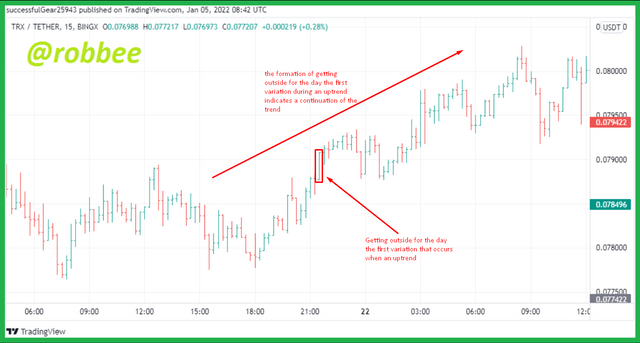
The picture above is an example of the first variation, which is when the open price is at the lowest price and the close price is at the highest price. When getting outside for the day like the example above can indicate two things, because the first variation is an uptrend, when the bar gets outside for the day in the first variation is formed during the uptrend chart, it indicates the uptrend will continue as shown above.
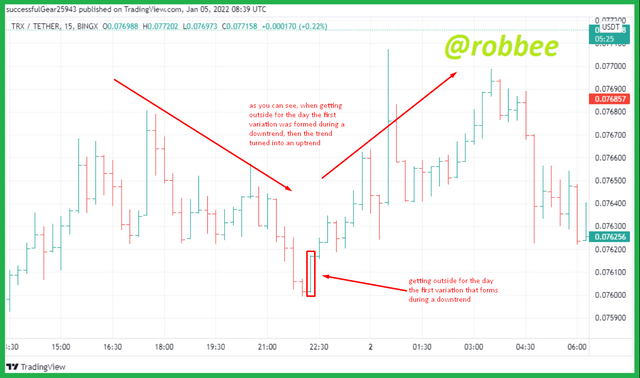
Second, when getting outside for the day the first variation is formed when the trend is in a downtrend, meaning that the trend will turn into an uptrend as in the example above.
The second variation occurs when the open price is at the highest price and the close price is at the lowest price. For an example, see the image below.
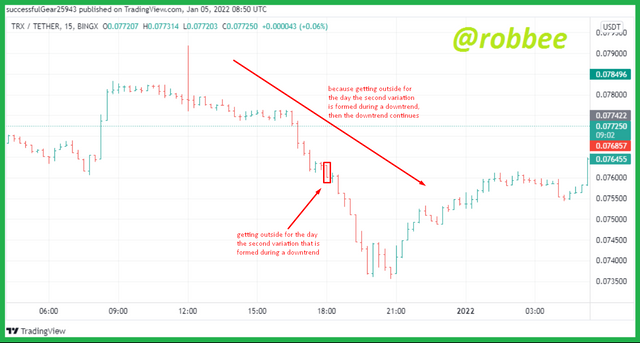
The picture above is an example of the second variation. When getting outside for the day like the example above can indicate two things, because the second variation is a downtrend when the bar gets outside for the day in the second variation is formed during a downtrend graph, it indicates the downtrend will continue as shown above.
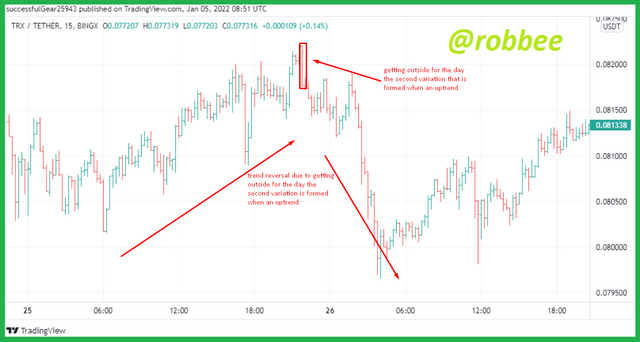
Second, when getting outside for the day, the second variation is formed when the trend is in an uptrend, meaning that the trend will turn into a downtrend as in the example above.
5.) Explain the Bar Combinations for Finding the close at the open for both conditions in each trend. (Screenshots required)
Bar Combinations is currently finding the close at the open. This combination occurs when the open price and close price are the same, or the open price and buy price are close together. Finding the close at the open has the same function as before, namely getting outside for the day which can find out whether the trend continues or reverses. When Finding the close at the open is formed when the trend is bullish or an uptrend, we can know the trend will continue or reverse. The uptrend will continue when Finding the close at the open is formed adjacent to the high price, if this happens to the market then the trend is likely to continue as in the example below.
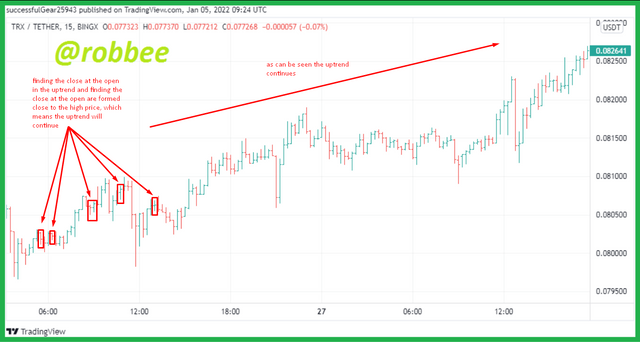
As we can see, Finding the close at the open is on an uptrend and is close to the high price, which means the bullish trend will continue.
Meanwhile, when Finding the close at the open is formed when the bullish trend and Finding the close at the open is formed close to the low price, it means that the trend will turn into a downtrend as shown below.
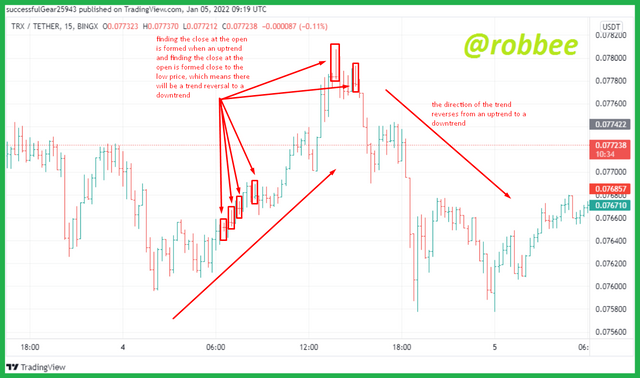
As can be seen in the picture above, the trend turned into a downtrend when Finding the close at the open was formed in a bullish trend and adjacent to the low price.
When Finding the close at the open is formed during a downtrend or bearish trend, it indicates that the trend will continue down or the trend will reverse up. The trend continues downtrend if Finding the close at the open is formed in a downtrend and Finding the close at the open is formed close to the low price, if this happens then the trend will most likely continue downtrend as shown below.
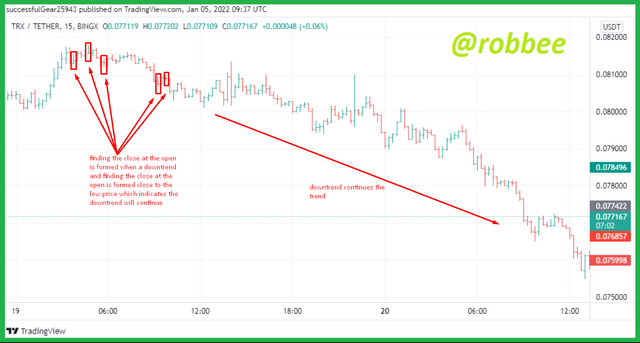
As can be seen in the picture above, the trend is again experiencing a downtrend when Finding the close at the open is formed adjacent to the low price.
Meanwhile, when Finding the close at the open is formed when the bearish trend and Finding the close at the open is formed adjacent to the high price, it means that the trend will turn into an uptrend or bullish as shown below.
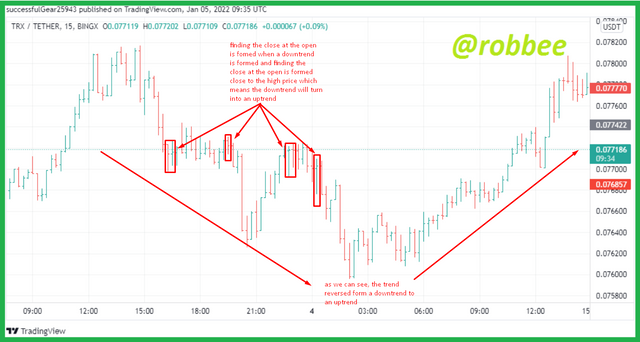
As can be seen in the picture above, the trend turned into an uptrend when Finding the close at the open was formed in a bearish trend and adjacent to the low price.
6.) Conclusion
When trading, we can choose to use candlesticks or price bars for chart displays because each display we choose has the same function, with a note that we also have to study each display we want to use as in this task, namely price bars. Price bars are the same as candlesticks, on the price bar we can also see the open price, the highest price, the closing price, and the lowest price and we can also do an analysis to find out the direction of the trend using the price bar. To identify the direction of the trend using price bars, the same as using other charts, namely for an uptrend or bullish trend, it occurs when the price forms a new high that is higher than the previous high and the latest low is higher than the previous low, while for a downtrend or bearish A trend occurs when the price forms a new high that is lower than the previous high and the new low is lower than the previous low. Three analyzes can be used to see the trend will continue or reverse using price bars, the three analyzes are spending the day inside, getting outside for the day, and finding the close at the open. The three analyzes can be used as desired but must be studied first to use them so that success in trading is greater and we do not get the wrong signal for the continuation of the trend direction or the opposite direction of the trend. As the initial explanation that the three analyzes can be used to see the direction of the trend, but I suggest adding indicators or other analyzes to strengthen the signal in the direction of the given trend and avoid false signals that can harm us.
References:
https://www.tradingview.com/chart/ITAaNOcQ/