Crypto Academy Season 4 | Week 2: Heikin-Ashi Trading Strategy - Homework for @reddileep
Hello to all,
This is my lesson for Professor @reddileep about the Heikin-Ashi Trading Strategy.
In the charts I have always used only traditional Japanese candles, so this for me is a decidedly radical novelty to which I am really happy to be able to approach and try to learn it.
1° Task
Define Heikin-Ashi Technique in your own words.
Heikin-Ashi is a selectable type of chart in virtually any trading platform. It is a derivative chart, as it is obtained not only on the basis of the real price.
The Heikin-Ashi is in fact obtained through a series of formulas that take into account, at each new candle, the prices and values of the previous candle (in particular the opening and closing prices and the maximum and minimum prices).
Thanks to these formulas (which I will try to explain in detail later), the resulting chart allows you to have a different perspective than the usual ups and downs of the market.
In particular, it has greater linearity, cleanliness and clarity thanks to which the trader can more easily recognize market trends (especially if bullish or bearish), to decide if it is time to open a new position or keep open a position.
2° Task
Make your own research and differentiate between the traditional candlestick chart and the Heikin-Ashi chart. (Screenshots required from both chart patterns)
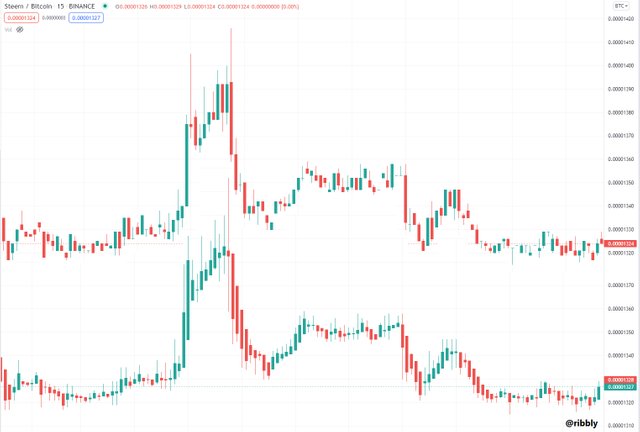
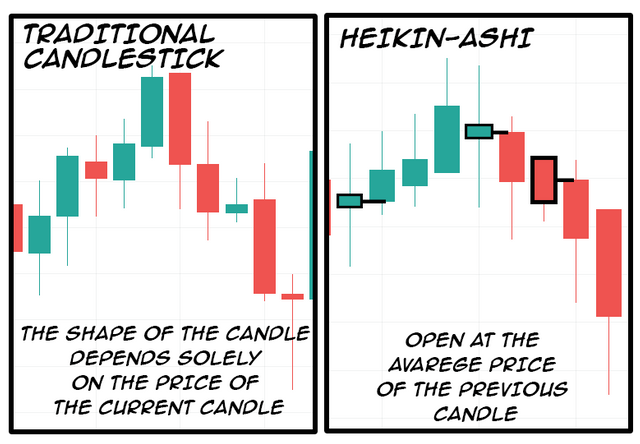
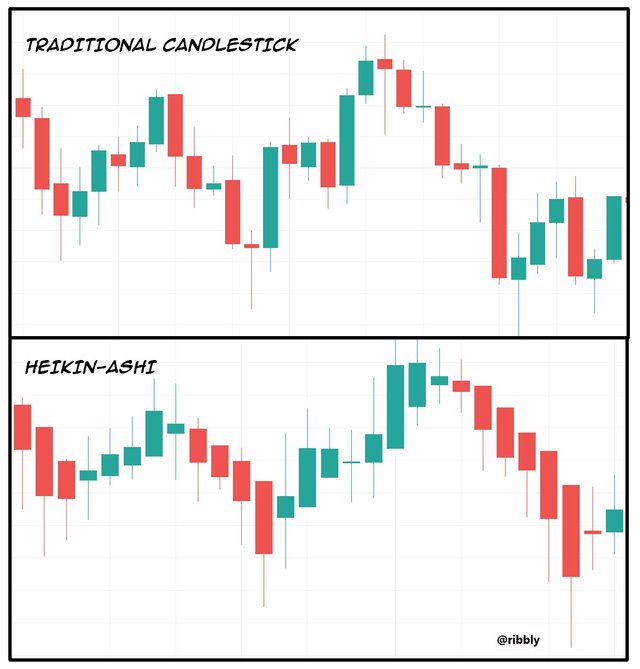
By observing a chart composed with traditional candles and comparing it to that obtained with Heikin-Ashi candles, one immediately observes a strong difference between the two.
- The Heikin-Ashi candles, as you immediately notice, have fewer candles of uncertainty and change color according to the general trend, allowing easy identification already at first glance of the trend. Conversely, Japanese candlesticks change color much more frequently, have many candles of uncertainty and making it less easy to identify a bullish or bearish trend.
- Heikin-Ashi candles are formed based on specific mathematical calculations. Japanese candles, on the other hand, are formed based on the opening and closing price (which determines the color: green if the closing price exceeds the opening price; red if the closing price is lower than the opening price), minimum ( the bottom of the candle) and maximum (the top of the candle) of that specific time period.
In the Heikin-Ashi charts, gaps never form, the candles follow each other without any interruption. In Japanese candlesticks, on the other hand, different types of breaks in the chart can form (as we saw in the last lesson by @allbert )
In the Heikin-Ashi charts, colors change only if a possible inversion of the general trend is identified with greater clarity. In Japanese candlesticks, on the other hand, they change more frequently as they depend on the opening and closing price of the single candle.
3° Task
Explain the Heikin-Ashi Formula. (In addition to simply stating the formula, you should provide a clear explanation about the calculation)
The Opening of the Heikin-Ashi candle is calculated using the following forumula:
This formula makes the Heikin-Ashi chart so harmonious in its succession of candles, as they are always linked together.
The opening of a candle is in fact determined by the average of the opening and closing of the previous candle.
The Closing of the Heikin-Ashi candle is instead calculated as follows:
It is therefore determined by the average opening, closing, maximum, minimum of the candle taken into consideration.
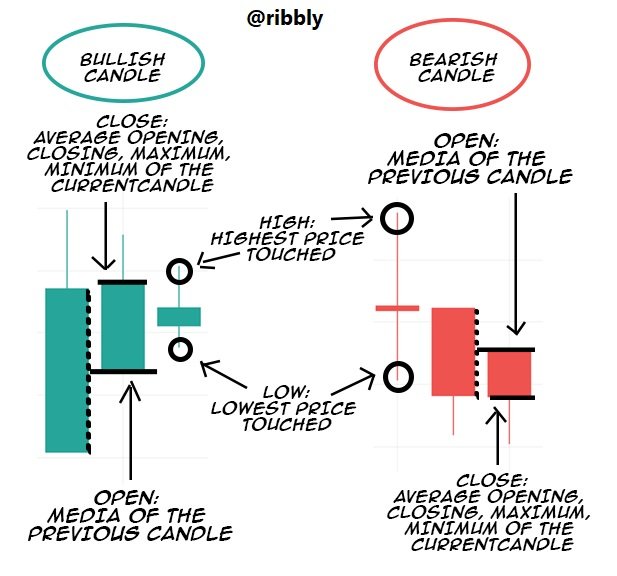
The high and low of the Heikin-Ashi candles are instead calculated in the same way as the classic Japanese candles:
High is the highest value reached between the opening and closing of the candle:
The Low is instead given by the lowest value touched between the opening and closing of the current candle:
4° Task
Graphically explain trends and buying opportunities through Heikin-Ashi Candles. (Screenshots required)
As already mentioned, what distinguishes the Heikin-Ashi chart is the greater clarity in determining a bullish or bearish underlying trend.
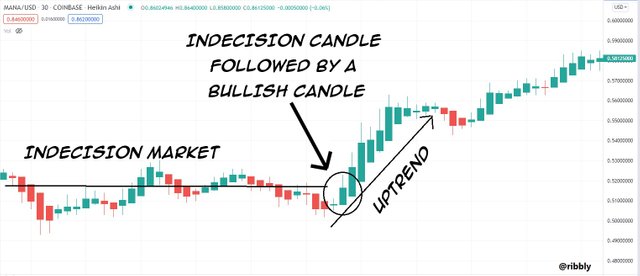
In particular, strongly bullish candles only have a wick at the top, while strongly bearish candles only have a wick in the tail. Candles of indecision on the contrary possess both the wick at the top and at the bottom.
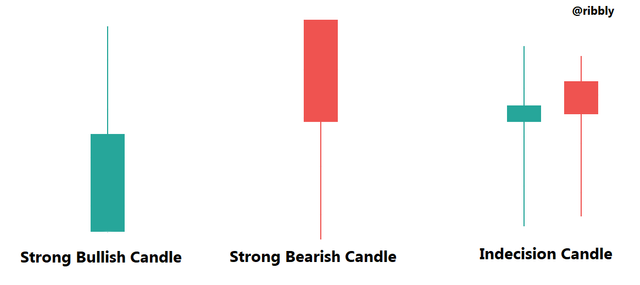
In uptrends we can thus observe many wicks upwards, while in downtrends there are many wicks downwards.
A good moment of entry that can be found in the Heikin-Ashi chart can be given by the phases of indecision, ie where a particularly strong trend, neither bullish nor bearish, has not yet formed. In these moments, if for example numerous bearish (red) indecision candles are observed, and suddenly a new strong bullish (green) one is formed, that could represent a good entry phase for a new bullish trend.
5° Task
Is it possible to transact only with signals received using the Heikin-Ashi Technique? Explain the reasons for your answer.
While highlighting trends and thus allowing clear identification of momentums, Heikin-Ashi is not foolproof when used alone (as is any other indicator).
For example, bearish candles can sometimes form even though the uptrend phase is not over yet, or vice versa.
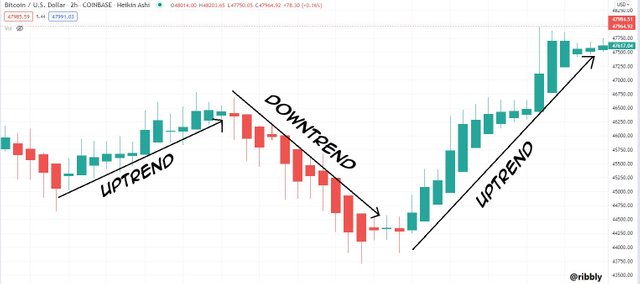
In the following chart, for example, at the end of a bearish trend, a sign of indecision can be observed followed by a strongly bullish candle. After that a series of uptrends takes place, interrupted by a phase of indecision. If, therefore, it seems that the right time to enter was clear, the same cannot be said of that to close the position.
In short, to strengthen the Heikin-Ashi strategy, other indicators such as those of the Exponential Moving Average (EMA) are of great help, and in particular @reddileep recommends using the 55-EMA and 21-EMA at the same time, which work as indicators of supports and resistances.
In particular, when you observe a bullish signal and you notice that the market is above the two EMA lines, then you can consider that candle as an excellent entry point:
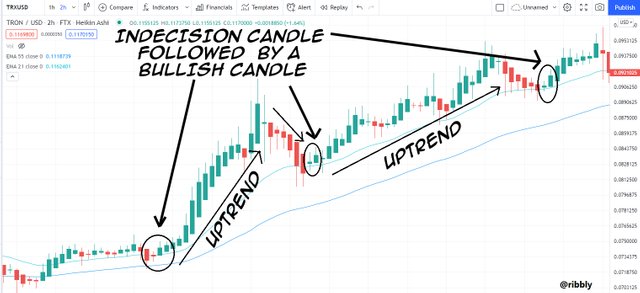
At this point, to understand a good exit point, you have to wait to see when the price falls again. It is not certain that as soon as the price falls, a bearish phase begin. In this tron chart, for example, we observe a bullish phase (in which both EMA lines are overcome by a strongly bullish candle) followed by a slightly bearish phase and then of indecision. A few candles drop slightly from the 21-EMA and then we see a new strongly bullish candle leading to a new bullish phase.
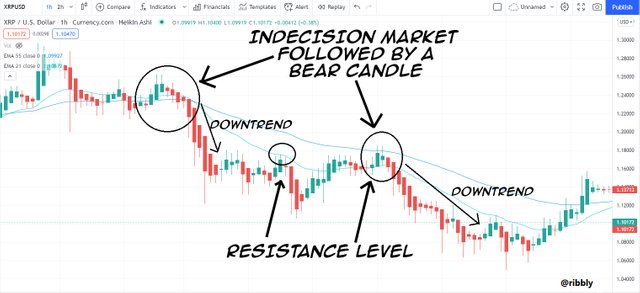
A bearish chart can instead be found when the candles remain below the two indicators 55-EMA and 21-EMA (sign of a resistance), and therefore a sell position could be opened if desired, although personally I believe that selling is more risky than buying.
An example:
6° Task
By using a Demo account, perform both Buy and Sell orders using Heikin-Ashi+ 55 EMA+21 EMA
I admit that I struggled to complete this task correctly, as I made several attempts probably taking into account a too short time frame.
In order to correctly complete the demo tests, in particular, it was useful to compare different time frames of the same chart, so as to find the most suitable moments of entry, since the relationship of the graph with the two EMA lines changes more. Below is an example of how the graph can change observing it in a shorter and longer period:
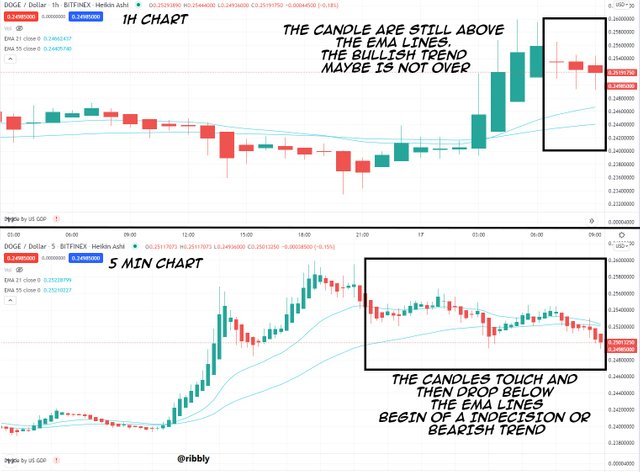
Anyway, here are the ones I managed to conclude with good results:
Buy order
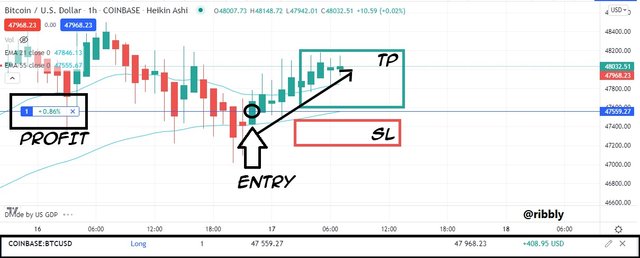
For example, in this 1-hour BTC chart, I noticed a reversal from bearish to bullish trend. In particular, we observe a strongly bearish candle followed by an indecisive one, to pass to a strongly bullish one. There I decided to open a buy position, although the candle was still below one of the two EMA lines. I set the SL below the EMA line and the TP above it.
I am currently in profit of 0.84% (or 408.95 USD).
Sell order
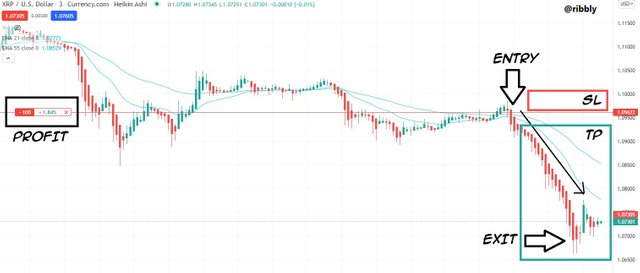
In the XRP chart I noticed a bearish moment followed by a period of indecision tending to the downside. When I noticed a strong bearish signal at the end of the indecision period, I opened a sell position, set the SL above the EMA line and closed the position as soon as I noticed that the signals were undecided again, with a profit of 1.84%.
Conclusions
I am really enjoying the Heikin-Ashi chart for its clarity and cleanliness, I thank Professor @reddileep for giving me the opportunity to meet it.
The strong bullish or bearish clarity of this chart allows the trader to have greater confidence in the decision of a buy or sell entry, however it is always good not to rush and consider other indicators such as the 55-EMA and 21-EMA and the different time charts in order to have even clearer signals of the general trend.
This post has been upvoted by @italygame witness curation trail
If you like our work and want to support us, please consider to approve our witness
Come and visit Italy Community
Great job,