[ Crypto Trading with Moving Average ]-Steemit Crypto Academy | S6W2 | Homework Post for @shemul21

Question 1

The moving average is quite literal with its name. It is an indicator that shows the average price change of a commodity over a length of time. It is a widely used indicator, and rightly so because it is quite easy to use, and helps traders in various ways to depict price action and market behaviour from past price data.
This indicator helps traders spot trends, trend reversals and even sniper entry points and a simple one-lined moving average can be found acting as support and resistance.
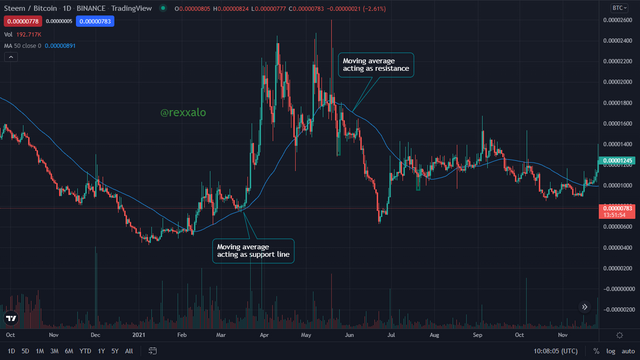
The moving average makes the chart easier to read, and that is one of the major roles that an indicator plays on a chart. It helps the trader identify which force is ruling the market just from a look. If the buying force is greater, the candlesticks appear above the moving average line and probably use it as a support line that holds it up.
If the market is ruled by a selling force, we would see that the chart is mostly plotted beneath the moving average line, and the moving average line is used as a resistance reference point, so we can say that the moving average acts as what is known as dynamic support and resistance.
The point of the creation of the moving average indicator is to smoothen out the data collected from previous prices into one result that is always dynamic in the sense that it is changed and updated frequently. It is also useful tremendously because it makes use of more recent data of price action, giving it's appearance more accuracy and usefulness when used to predict price behaviour.
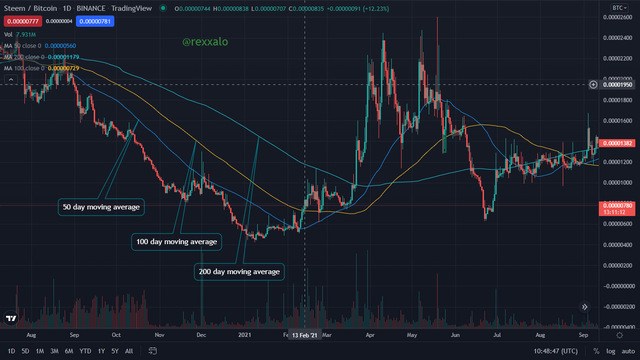
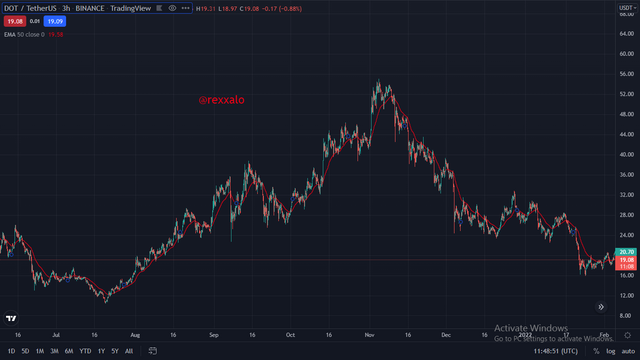
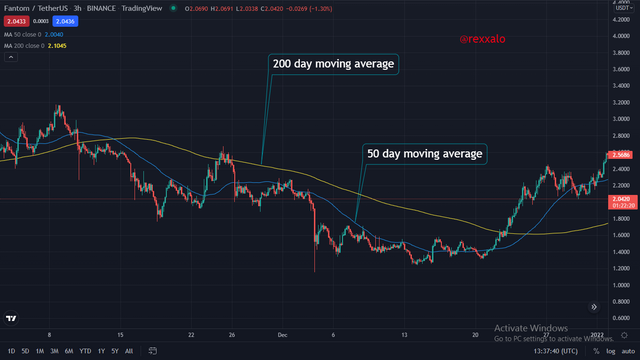
The moving average is also regarded as a "lagging" indicator, mainly because it deals and depends on past prices to calculate its values. To explain further, when we adjust the moving average length, what we are really doing is increasing the length of days whose averages are taken into consideration to be calculated. From the screenshot above, we can see how close the three moving averages are to the candlesticks, this is because they are all in different day lengths.
That is to say, the 50-day moving average is a price average calculated over 50 days in the market, the 100-day moving average is a price average calculated over 100 days and so on. This explains why the lines are differently spaced and have to also differentiate with colours.
Also, we should note that the larger the length of the average, the slower the moving average would be to price changes, especially minute ones. The moving average, whenever it is seen moving upwards simply depicts an uptrend the same way does it depicts a downtrend whenever it's seen moving downwards.
As simple as the moving average is, two moving average lines can be combined together to achieve better chart analysis, on the condition that they both have different lengths of average periods. When combined we can now see moving average patterns like the death cross and the golden cross, which helps a trader spot a trend reversal more easily. To get even better analysis results, the moving average can be combined with other types of indicators as it too has its own flaws which are mostly governed by its lagging characteristics.
Question 2
there are three main types of moving average indicators, and this is because their calculation criteria differ in a lot of ways. While answering this question we'll be looking in-depth into these three different types of moving average and what differs them from each other.
The simple moving average
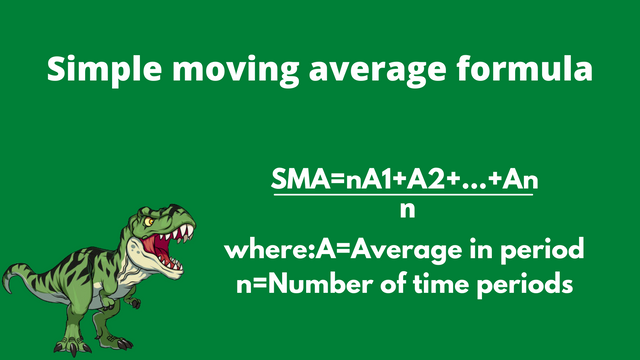
The simple moving average as its name implies is the simplest one of all the three, and it consists of just one line on the chart. The simple moving average is arrived at by calculating the mean from a group of values, and that is divided over a certain period of time.
.png)
It has the same calculation as the regular arithmetic mean, but with the difference in the value type. The simple moving average is dynamic as it changes in appearance in correspondence to the change in price averages. Using the formula I have provided above, let us look into an example of calculating the moving average.
Example:
- A1 = $35, A2 = $45, A3 = $40, A4 = $30, A5 = $45
- n = 5
- Simple Moving Average = (35+45+40+30+45)/5
- Simple Moving Average = (195)/5
- Simple Moving Average = 39
The exponential moving average
The exponential moving average is a moving average that is quite similar to the simple moving average but differs in the calculation procedure and formula. This major difference affects its appearance on the chart also. The formula of the exponential moving average has been calibrated in a way that it gives more weight to more recent price data, unlike the simple moving average that has an even balance between all price data from both older and newer price data.
.png)
The estimated moving average has a different course with the simple moving average on the chart, to better explain the formula, to calculate the exponential moving average, we need two main price data, which are the current price data, and the Exponential moving average of the previous period, and whenever this is not available, it is substituted by the simple moving average of the first period. We also need to put into consideration "n" which is the length of period for the moving average calculation.
Example:
current price data (c) = $50
previous exponential moving average (p) = $40
n = 10 days
Exponential moving average = (C-P) x (2 / (n + 1)) + P
Exponential moving average = (50-40) x (2 / (10 + 1)) + $40
Exponential moving average = (10) x (2/11) + $40
Exponential moving average = (20/11) + $40
Exponential moving average = $41.8
The weighted moving average
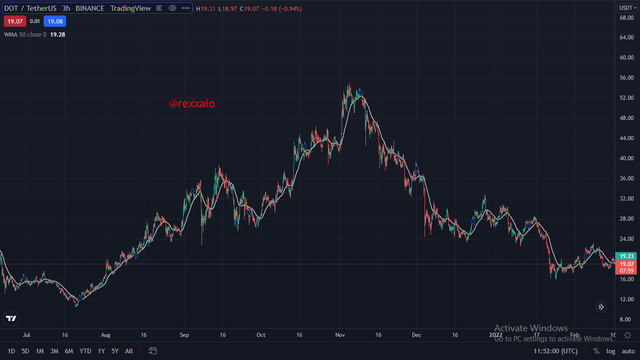
The weighted moving average has similarities with the exponential moving average in the sense that they both put more weight on recent price data as these are the price data that matter the most in the market.
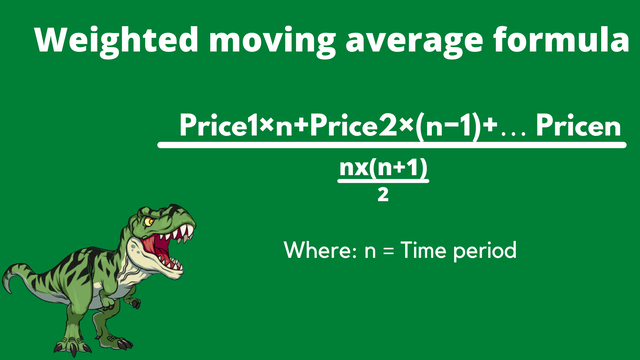
Because of this feature, the weighted moving average indicator is more suitable for short term trades and short term analysis whereas the exponential moving average and the simple moving average can be used for long term trades and analysis. Below I have shown the formula for the weighted moving average.
.png)
To further explain the formula above, "p" represents price data and "n" represents the time period. This indicator's calculation differs from the other two in the sense that it is very visible that the time period is put into more use than the other two calculations. Let us look into an example of the weighted moving average calculation.
Example:
- Price 1 = $50
- Price 2 = $45
- Price 3 = $50
- n = 3
- Weighted moving average = (50 x 3) + (45 x (3-1)) + (50 x (3-1))/6
- Weighted moving average = ((150) + (90) + (100))/6
- Weighted moving average = 240/6
- Weighted moving average = $40
The three moving averages that have been explained above are the most popular, and there are others that I would be mentioning and explaining.
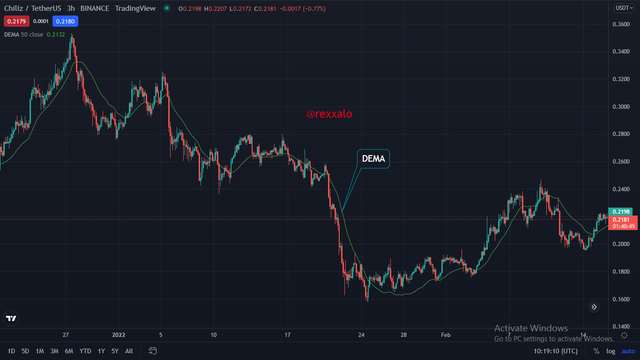
Double Exponential Moving Average (DEMA):
The double exponential moving average is an upgrade of the exponential moving average as it is even more responsive to price changes when compared to the Exponential moving average. It is also suitable for making short term trades. Below I have shown a pictorial description of the Double exponential moving average.
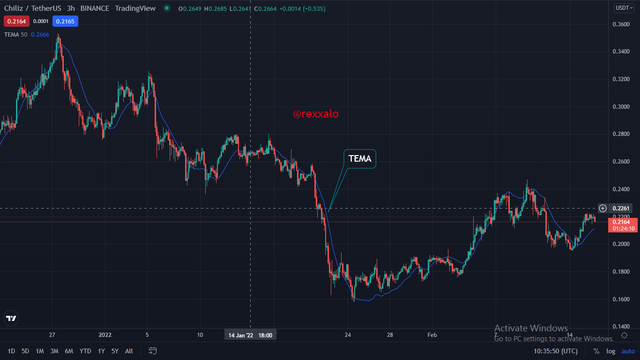
The Triple Exponential Moving Average (TEMA)
The triple exponential moving average is another type of moving average that triples the weight that the E.M.A puts on recent price data, This further increases its accuracy when being used for analysis for a short term trade, as it is more recent and lags less than the triple exponential moving average and the moving average. Below I have shown the pictorial example of the Triple exponential moving average.
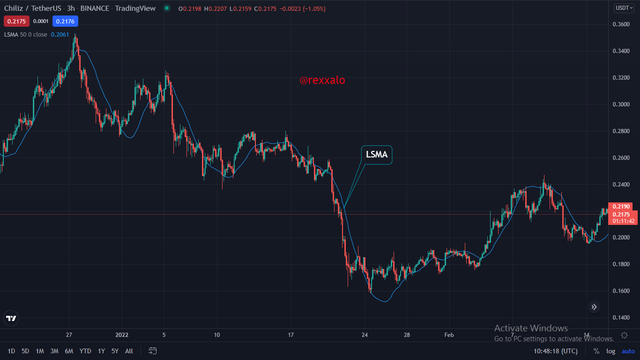
The least-square moving average (LSMA)
The least-square moving average is to me, the most complex. It is a moving average that is based on calculations carried out using the least-squares of the price data and linking this calculation to a regression line for the next time periods.
Differences between S.M.A, E.M.A and W.M.A
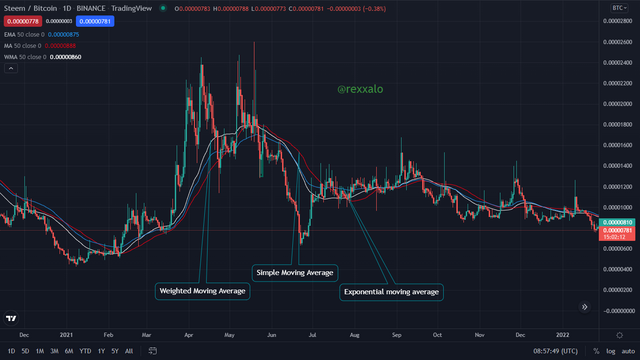
From the screenshot above we can notice that the course of the three moving averages is quite similar but different. I have labelled the simple moving average, the exponential moving average and the weighted moving, and have also differentiated them with colour, as the simple moving average appears red, E.M.A appears blue and the W.M.A appears white.
| Simple Moving Average | Exponential Moving Average | Weighted Moving Average |
|---|---|---|
| The simple moving average is suitable for detecting long term trades in comparison to the E.M.A and W.M.A | The Exponential moving average is suitable for sighting long term trades and also short term trades | The Weighted moving average is suited for mostly scalping and sighting short term trades. |
| The Simple Moving average grants equal weight to both old and recent data | The exponential moving average gives more weight to recent price data | The weighted moving average gives more emphasis and weight on the more recent changes of the price data |
| Analysis carried out with S.M.A with a higher period value is more accurate | The analysis carried out using the E.M.A with lower period values is more accurate than analysis carried out using higher period values | The analysis carried out with a W.M.A with higher period values is accurate and it is the same case with lower period values. |
Question 3
To find entry and exit points on the chart we have to respect the current trend the market is on to properly the market. There are two main types of trends, the uptrend or bullish trend, and the downtrend or the bearish trend. We would first look at these two trends and the behaviours of the moving average in both situations.
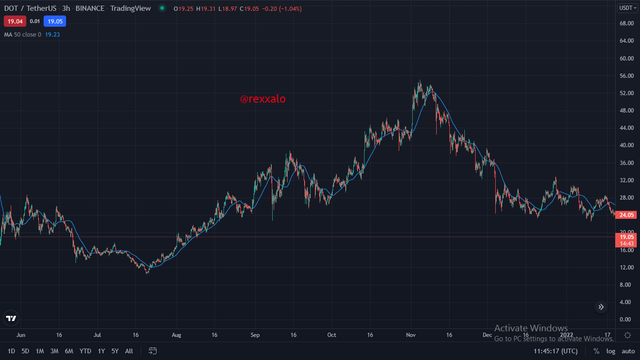
Entry and exit points on an uptrend using moving average
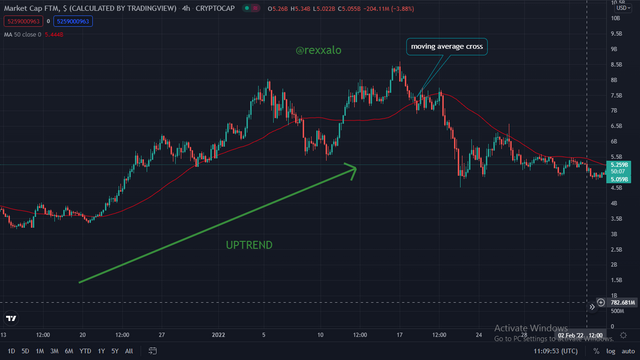
On an uptrend, we can notice that the moving average line is heading upwards, together with the candlesticks. We can also notice that the moving average line acts as a support line for the candlesticks as they tend to bounce off the line numerously. we can also notice from the chart that the candlesticks crossed the moving average line, and when they did, it saw a trend reversal.
This can serve as our entry and exit point indicator. I will explain how to get an entry point using just one moving average line and then I would go into getting entry and exit points using two moving average lines with different period lengths.
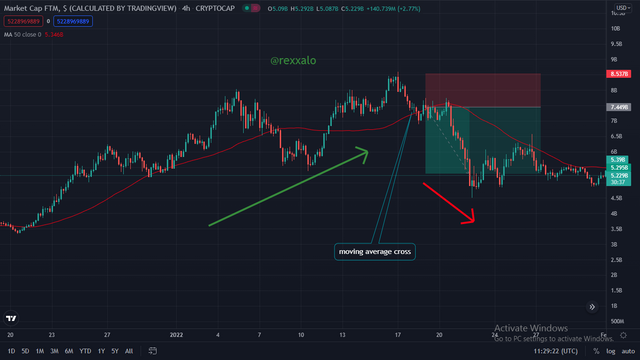
Using risk management of 1:2, I have shown the correct entry point, together with the take profit and stop loss values. To explain further, I have placed the entry point at the point where the candlestick crossed the moving average line. This indicated that there might be a trend reversal, and shows a great opportunity to place a sell trade, as the former trend was an uptrend.
Another way we can identify entry and exit points is by combining two moving averages of different period lengths, these two moving average indicators would have lengths of 50 and 200 as these two periods together are known to be more suitable to work with when analysing for both long term and short term trades.
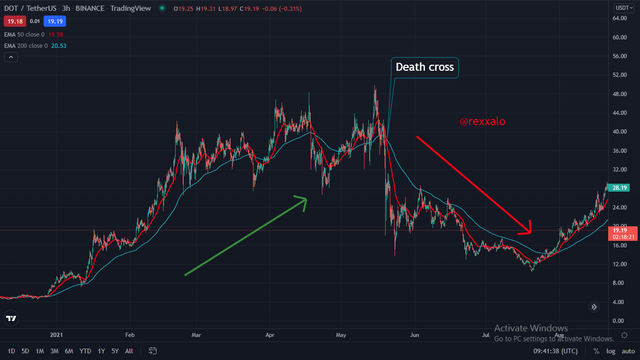
The strategy we lookout to spot when dealing with an uptrend is the "Death cross strategy" This is a cross over strategy that occurs when the 50 period moving average crosses the 200-period moving average line from up to down. This is because the 50 period moving average reacts faster to price change, and so it heads downwards first, crossing the slower 200-period moving average.
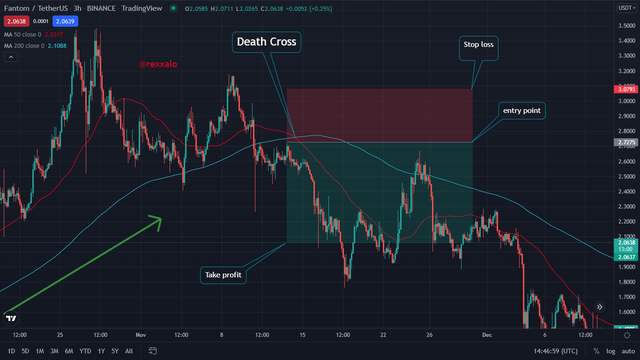
The death cross is a reliable confirmation for traders who use the moving average indicator of a trend reversal. It signifies the exhaustion of the buying force and the apparent new strength of the sellers in the market. I have made sure to place my stop-loss slightly above the resistance level and my take profit slightly below the support level, and also using risk to reward ratio of 1:2.
Entry and exit points on an downtrend using moving average
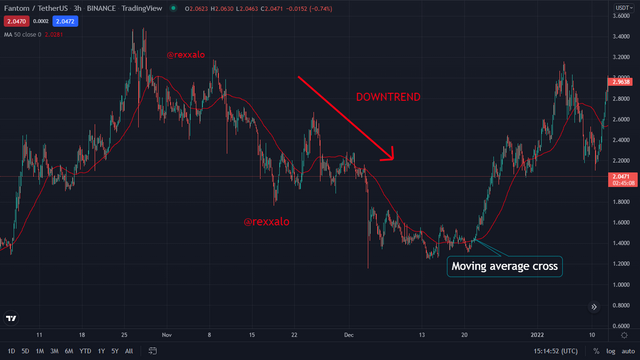
On a downtrend, we can notice that the moving average line is heading downwards, together with the candlesticks. We can also notice that the moving average line acts as a dynamic resistance line for the candlesticks as they tend to bounce off the line numerously. we can also notice from the chart that the candlesticks crossed the moving average line, and when they did, it saw a trend reversal.
Now let us be more practical and identify where the entry and exit points would be and why. From the chart above we notice that it is a downtrend, so we ate looking to sight buying opportunities.
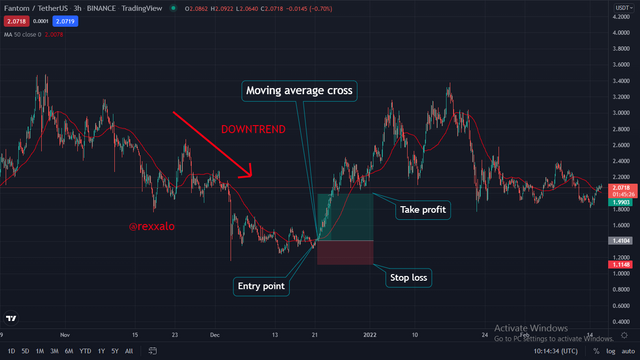
Using risk management of 1:2, I have shown the correct entry point, together with the take profit and stop loss values. To explain further, I have placed the entry point at the point where the candlestick crossed the moving average line. This indicated that there might be a trend reversal, and shows a great opportunity to place a buy trade, as the former trend was a downtrend.
Another way we can identify entry and exit points is by combining two moving averages of different period lengths, these two moving average indicators would have lengths of 50 and 200 as these two periods together are known to be more suitable to work with when analysing for both long term and short term trades.
The strategy we are looking to spot when dealing with a downtrend is the "Golden cross strategy" This is a cross over strategy that occurs when the 50 period moving average crosses the 200-period moving average line from down to up. This is because the 50 period moving average reacts faster to price change, and so it heads upwards first, crossing the slower 200-period moving average.
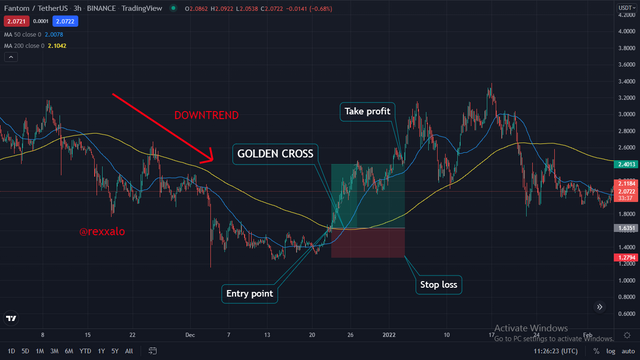
The Golden Cross is a reliable confirmation for traders who use the moving average indicator of a trend reversal. It signifies the exhaustion of the selling force and the apparent new strength of the buyers in the market. I have made sure to place my stop-loss slightly below the support level and my take profit slightly above the resistance level, and also using risk to reward ratio of 1:2.
Question 4
The Moving average crossover is one of the most reliable ways that traders use to depict a trend reversal. The exponential moving average crossover is carried out by two moving average lines. These two lines were calculated with two different period values therefore they would not follow the same course.
Our professor @shemul21 suggested that the period values for these two lines be 50 and 100 days. I personally prefer to use 50 and 200 as it has an even combination of averages between shorter periods and longer periods, the crossovers are caused by the different reaction times to price change.
The faster 50 days moving average is said to be the one doing most of the crossover activities because it has a faster reaction in comparison to the 100 or 200-day Exponential moving average. One way to identify a moving average with a longer period is by assessing the moving average that is farther away from the current price
The Crossover strategy is reliable, but it is usually effective on either the uptrendor the downtrend, and is not effectively as compatible with linear trends or straight horizontal trends.
This is because the crossover strategy is needed for detecting trend reversals, so when there is not much to reverse from, following the moving averge's cross might lead to wrong trading decisions.There are two main types of crossovers when dealing with the moving average, and they are the Golden crossover and the death crossover.
Golden crossover
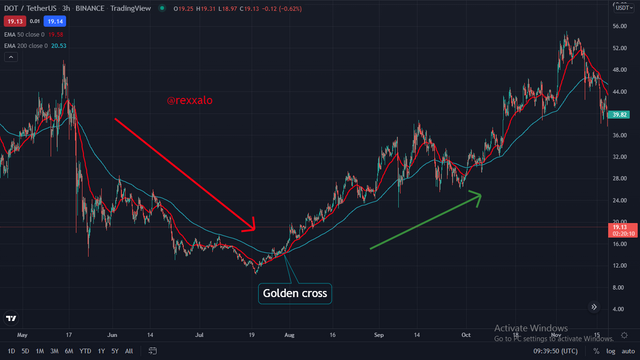
The golden crossover is a buying indicative crossover that appears when the Exponential moving average that has a faster reaction to price change crosses the Exponential moving average which is slower in reaction from down to up, meaning the line goes from under the slower Exponential moving average ( Exponential MA with a bigger period length) to on top of it. I have shown another example of this below, and how it indicated a trend reversal accurately.
Death crossover
The Death crossover is a selling indicative crossover that appears when the Exponential moving average that has a faster reaction to price change crosses the Exponential moving average which is slower in reaction from up to down, meaning the line goes from above the slower exponential moving average ( EMA with a bigger period length) to coursing under it. I have shown another example of this below, and how it indicated a trend reversal accurately.
There are some other criteria a trader needs to keep in mind when using the crossover strategy, the cross over can also be suited for all kind of trading, the intra-day trading, the long term trading, and the scalp trading. To adjust the cross over strategy to all these trading types, we also have to adjust the periods simultaneously. Some of the commonly used period pairs are below:
| Trade length | EMA Pair |
|---|---|
| short term trades | 9 day EMA with 21 days EMA |
| midterm trade | 25 day EMA with 50 days EMA |
| long term trades | 50-100 day EMA with 100-200 Day EMA |
The Moving average cross over strategy is very versatile, and works best when there is an established trend. How ever the number of trend reversal indications depends highly on the time frame being analyzed. If the trader goes for a daily time frame for analysis, he would see less indications to buy or sell than when he goes for an hourly chart for an analysis.I have explained how to enter and exit trades when using the cross over strategy in the previous question and repeating myself would be unnecessary.
Question 5
Every indicator has flaws, no matter how reliable they are, and these flaws sometimes is individually based as there exists different types of traders with different trading psychologies, so one indicator can not meet all the requirements for diversified trading systems. Here are some of the limitations of the Moving average indicator.
The moving average is a lagging indicator:
The moving average usually makes indications late, making trade entries late too, and this can cause trading mishaps as entries should be precise and specific when trading.Wrong value adjustments could be fatal:
Using the wrong period values for the wrong type of trading would definitely lead to inaccurate entries once in a whileNot all datais considered:
The Moving average does not put into consideration other price data such as opening and closing price and is focused on the averages, which is good but not always sufficient for analysis.There are no rules to how to use Moving average lines:
there is no particular rule to follow when using the moving average lines, and because of this, some traders could use it in a way that it turns out to be unproductive.The moving average is mostly a trend indicator:
The moving average is mostly used to detect the current trend and acts as a dynamic resistance and support and hardly used to detect trade opportunities when using only one moving average line.
CONCLUSION
The moving average indicator is a simple type of indicator that consists of one line. it can be combined with itself to make and spot trade entry points. There are several types of the moving average indicator, and this sis because there are diverse ways of calculating price average over a period of time. The three main types of the moving average indicator are The simple moving average, the weighted moving average and the weighted moving average.
The moving average even though reliable is also not perfect, as it has flaws to it's calculations when being used to make certain analysis. This problem however can be remedied with the implementation of additional indicators to make reading the chart and analysing it easier and aid accurate trade entry identification.
This lecture and assignment was a really enjoyable one, and I am glad i was able to partake in it and explain in my knowledge what the moving average is, and how to use it to make trade entries. special thanks to the professor @shemul21 who made an extensive lecture on the indicator. I hope my answers were satisfactory and you like the post. Till we see again, adios!