Steemit Crypto Academy Season 3 Week 4 - Beginner's Course | Candlestick Patterns.
Hello Steemians, welcome to season 3 week 4 of the Steemit Crypto Academy. In our last class, we talked about the Japanese candlestick chart and its anatomy. In today's lesson, we will be learning about Candlestick Patterns and the Psychology behinds its formation. Understanding candlestick formations and the psychology behind their formation plays a vital role in carrying out an effective technical analysis.
Candlestick patterns are one of the powerful tools a trader looks out for and understanding how to read them can help a trader make good trading decisions. These patterns occur regularly in the chart and the psychology behind them all boil down to the demand and supply of assets.
Understanding how to read candlestick patterns gives accurate information on market behavior. These patterns can signify configuration or reversal in the price of an asset.
In this lesson, we will be discussing the most common and regular candlestick patterns and the psychology behind their formations. Similarly, we will be discussing what these patterns signify and how a trader can make good trading decisions with them.

Engulfing Candlestick Patterns
The engulfing pattern is one of the important candlesticks that every trader looks out for. The engulfing pattern is made up of two candle bodies with the second candle covering the previous candle body completely. This can be a bullish engulfing candle or a bearish engulfing candle.
When the engulfing candlestick pattern occurs in an uptrend, it signals a reversal in the uptrend. Also, engulfing pattern shows that buyers are no longer in control of price. Sellers have taken control of price and we usually see price reverse in the opposite direction.
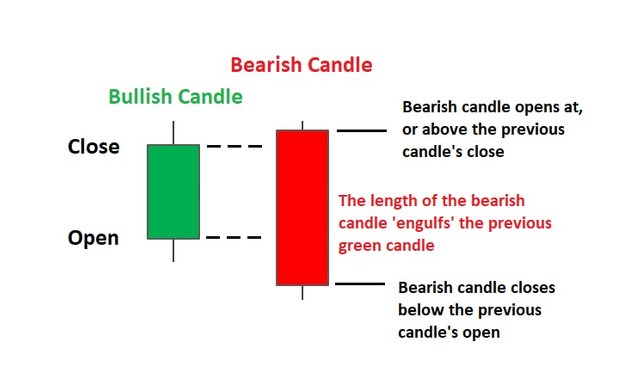
From the anatomy of the candlestick we discussed in the previous class, the bearish engulfing candle has a close below the open of the previous candle. This is how the bearish engulfing candle looks like in the chart.
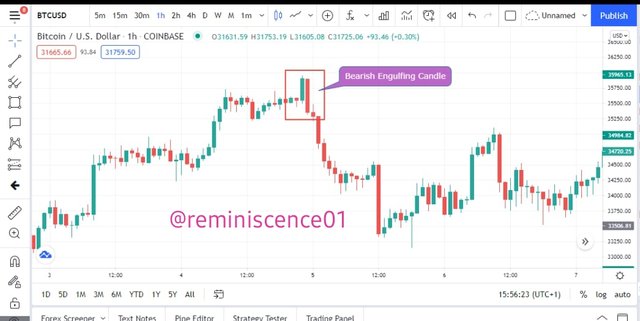
From the chart above, we can notice how price reversed in the opposite direction after the formation of a bearish engulfing pattern. This shows that sellers have taken control of price.
Similarly, when an engulfing candlestick pattern occurs in a downtrend, it clearly shows that buyers have taken control of price and when this happens, we usually see price reverse in the opposite direction.
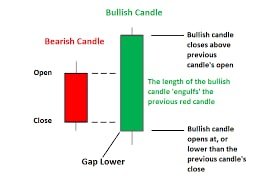
From the anatomy of the candlestick we discussed in the previous class, the bullish engulfing candle has a close above the open of the previous candle. This is how the bullish engulfing candle looks like in the chart.
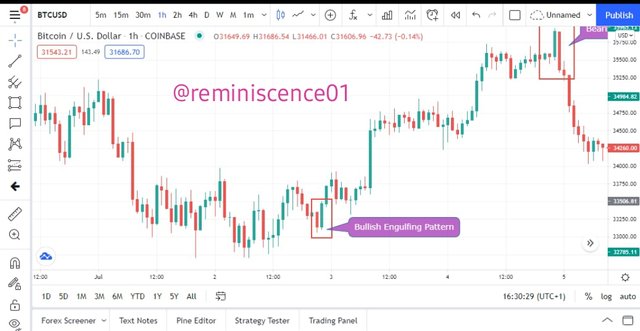
From the chart above, we can notice how price reversed in the opposite direction after the formation of a bullish engulfing pattern. This shows that buyers have taken control of price.
Doji Candlestick Pattern
This is another important candlestick pattern traders look out for on the chart. The Doji candle signifies indecision in the market. The Doji candlestick pattern shows that price opened and closed at the same price. What this means is that both buyers and sellers are not in control of the price. Unlike the engulfing candlestick pattern here it is very easy to determine who is in control of price.
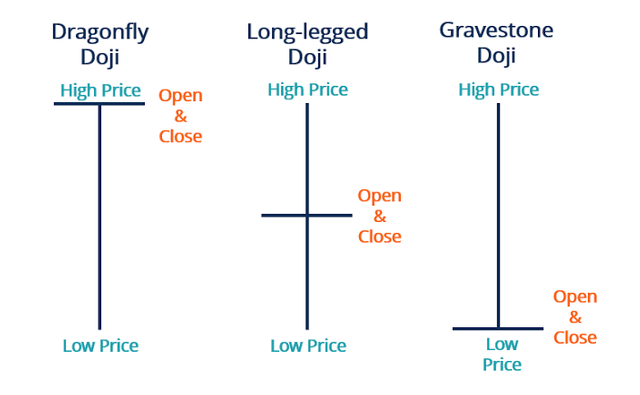
The dragonfly Doji is a bullish reversal pattern and when occurred in a downtrend, it signals a reversal in price. Similarly, the Gravestone Doji is a bearish reversal candlestick pattern that signals a reversal in price when it occurs in an uptrend.
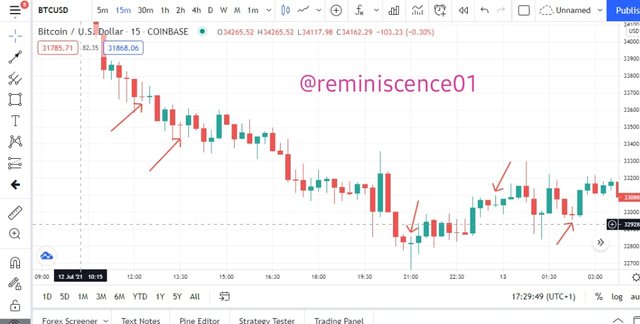
The Doji candles simply indicate that buyers are unable to push price higher and sellers are also unable to push lower, this bringing price back to the opening price. Let's take a look at the Doji candlesticks on the chart.
The best advice to trade Doji candles is to wait for the next candle to form. Similarly, these candles show that the current trend is losing its strength and a possible reversal can happen. But as a trader, when this candles form, you can't tell if the price is going up or down. So the best measure to take is to wait for the next candle to form before taking a decision.
Hammer Candlestick Pattern
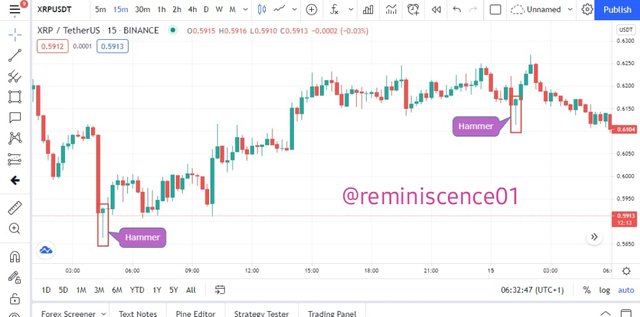
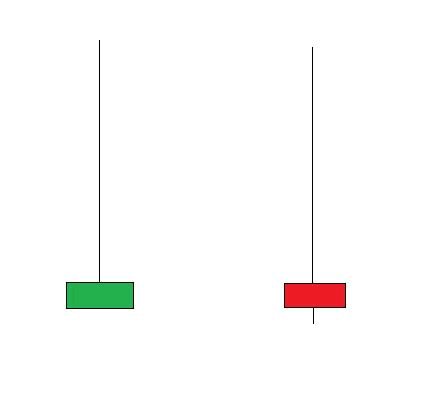
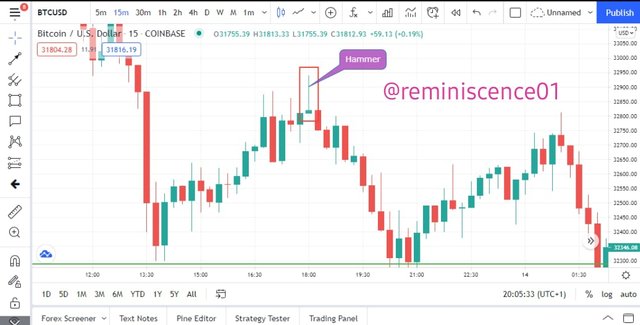
The hammer candlestick pattern is very important especially when it appears at support and resistance levels. The anatomy of a hammer shows that the closing of the candlestick and the opening price is almost at the same price. This candlestick has a long wick which shows strong price rejection from the buyers.
From the image above, we can see a long tail formed which shows that at the beginning of this candle, sellers pushed price down. But after some time, buyers came in and took control of price by closing above the open of the candle. This is a strong reversal pattern when they appear in a trending market especially at a support level. Example of the hammer on the chart.
We also have the inverted hammer which is a bearish pattern of the hammer. The inverted hammer has its low, open, and close at almost the price. When the inverted hammer occurs in an uptrend, it usually signals a reversal to the downside. What this means is that, when the candle opened, buyers were in control of price and pushed price to the upside. After some time, sellers came in to take control and push price downward forming a long candle wick.
The inverted hammer is a strong reversal signal especially when it appears at a resistance level. Traders can use this to either take profits off the market or look for a potential sell position. Example of inverted hammer on the chart.
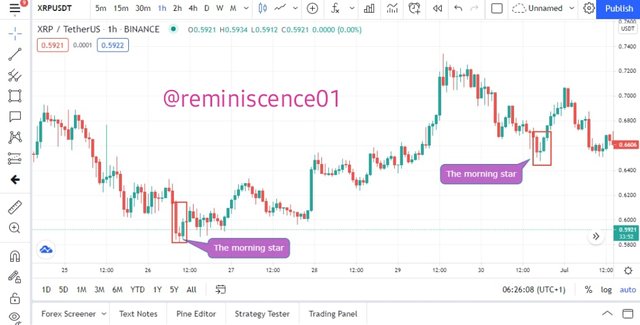
The morning Star
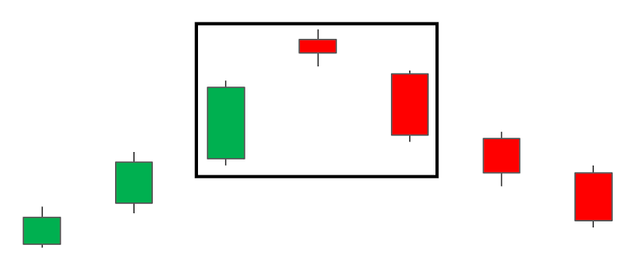
The morning star is a strong bullish reversal candlestick pattern. This candlestick pattern is made up of three candlesticks.
- The first candlestick is a strong bearish candle which indicates that sellers are in control of price.
- The second candlestick is a small Doji candle which shows weakness and the inability of sellers to push price down further. When this happens, it shows that the trend is weak and a possible reversal is about to happen.
- The third candle is a bullish candle engulfing the second candle. This candle shows that buyers have taking control of the market to push price up.
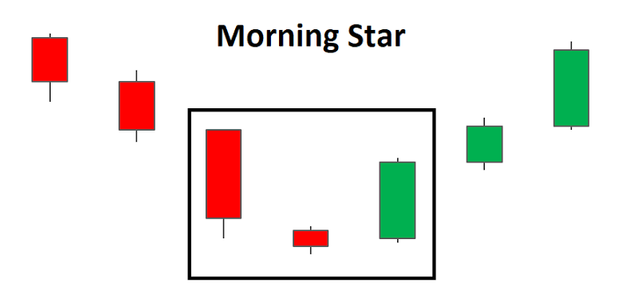
The psychology behind the morning star is that sellers were in control of price until buyers came in and take over the market from the sellers. The formation of the morning star in a downtrend is a strong bullish reversal candlestick and the signal is stronger if it is formed at a support area. Example of the morning star on the chart.
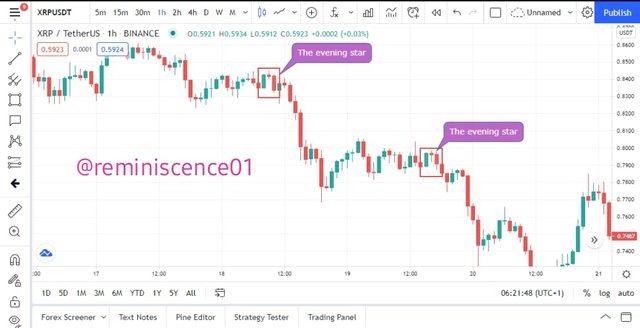
The Evening Star
The evening star is the opposite of the morning star. This candlestick pattern is a strong bearish reversal pattern also made up of 3 candles just like the morning star.
- The first candle is a bullish candle which shows that buyers are in control of price.
- The second candle is a small Doji candle which shows the weakness of the buyers and the inability of the buyers to push price further up.
- The third candle is a long bearish candle engulfing the previous Doji candle. This third candle shows that sellers have taken over control of price from the buyers and this is followed by major selling pressure.
The psychology behind the evening star is that buyers were in control of price until sellers took over control from the buyers. The evening star is a strong bearish reversal pattern especially when it is formed at a resistance level. Example of an evening star on the chart.
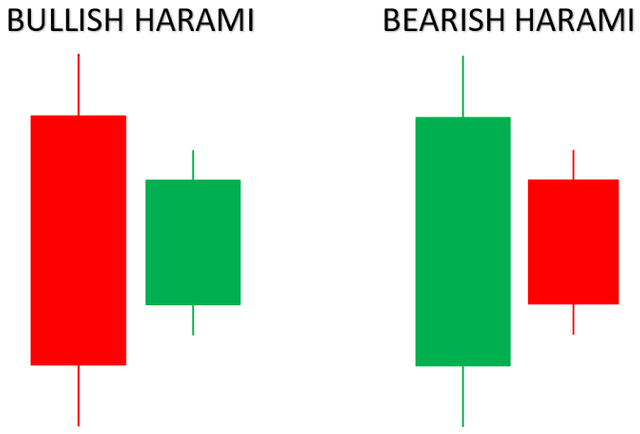
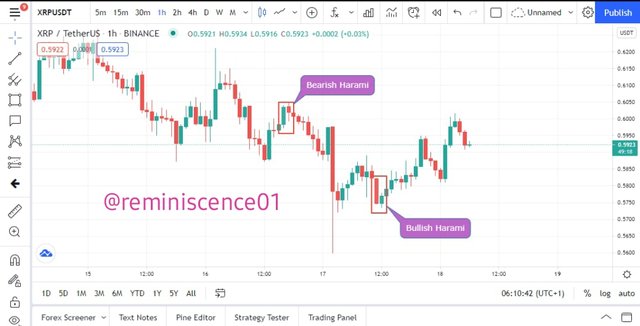
The Harami Candlestick Pattern
The Harami candlestick pattern is another reversal candlestick pattern or a continuation pattern that gives traders a signal that price is about to reverse or continue to its original direction. The Harami candlestick pattern is made up of two candles. The first candle is a large body candle followed by a small body candle which is showing indecision between buyers and sellers.
This always occurs after a bullish or bearish rally, then price consolidates for a while as buyers and sellers struggle over control of price. This gives rise to the formation of the small indecisive candlestick of the Harami pattern.
Traders look out for the Harami candlestick pattern at the top or bottom of a trend for price reversal. The bullish harami is a strong bullish reversal especially when it is formed a major support area. Similarly, the bearish harami is a strong bearish reversal candlestick pattern especially when it occurs at a major resistance level. Example of the Harami candlestick pattern on the chart. The Harami candlestick pattern can also serve as a continuation when it appears in the middle of a trend.
Trading Candlestick Patterns
Now we have learned about the Japanese candlestick and its anatomy, also the different patterns of the candlestick and the psychology behinds its formation. Bear in mind that these candlesticks are not a trading strategy on their own. Seeing this pattern anywhere on the chart doesn't mean you should take a buy or sell trade. These patterns work best with other technical analysis tools a trader has designed for his trading style.
For example, a trader who uses the RSI indicator will make a quick trading decision when a hammer is formed at an oversold region. This trader cannot just open a position anywhere the hammer is formed. Rather he will be expecting these candlestick patterns in very important areas in the market.
So here are few things you need to consider before making any trading decision with candlestick patterns:
Where is this pattern formed:
Just like we discussed previously before you make a trading decision using candlestick patterns, you need to make sure it is in line with other technical tools in your trading style. This can be support and resistance areas, RSI overbought and oversold regions, trendlines, moving averages, break retest break strategy, etc. These candlesticks patterns give you a confirmation that price is about to reverse or continue in its original trend.
The size of the candles:
Large body candles signify high volume and strong buying or selling pressure in price. The size of the candle plays an important role in determining how strong the buyers or sellers are controlling the price. You might not want to take any trading decision when the candle bodies are small relative to the previous candle. For a small bullish candlestick, this tells you that there is no much volume in the market and buyers are struggling to take control of price.
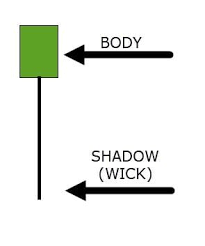
The Candlestick anatomy:
Here, a trader look at the opening price, the closing price, the high and the low of the current candlestick relative to the previous candlesticks. Similarly, the trader also look at the candlestick wicks to determine how well price closed after reaching a certain high or low. Furthermore, the candlestick body also tells the trader the distance between the opening price and the closing price of the candlestick. A trader considers all this candlestick anatomy to determine the strength of price and also who is in control of price.
Conclusion
In this lesson, we have identified the most common candlestick patterns and the psychology behind the formation of these candlestick patterns. Candlestick patterns are very important technical analysis tools. Every trader must learn how to read candlestick charts in order to make a better trading decision.
Now we have discussed Japanese candlestick anatomy and also the candlestick patterns, I hope you can identify these patterns on the chart and also interpret what they mean in the market.
In the next lesson, we will transit into other important technical analysis tools. I believe every investor or trader cannot do without technical analysis and for this reason, it is very important to have any available knowledge to make better trading or investment decisions.
Thank you for being part of this lesson.
Best regards,
@reminiscence01
Homework Tasks
- In your own words, explain the psychology behind the formation of the following candlestick patterns.
- Bullish engulfing Candlestick pattern
- Doji Candlestick pattern
- The Hammer candlestick pattern
- The morning and evening Star candlestick pattern.
- Identify these candlestick patterns listed in question one on any cryptocurrency pair chart and explain how price reacted after the formation. (Screenshot your own chart for this exercise)
- Using a demo account, open a trade using any of the Candlestick pattern on any cryptocurrency pair. You can use a lower timeframe for this exercise.(Screenshot your own chart for this exercise).
Homework Guidelines
- Homework must be posted into the Steemit Crypto Academy community.
- Plagiarism is a great offense in Steemit Crypto Academy and it won’t be tolerated. Ensure you refrain from any form of plagiarism.
- Your post should not contain less than 300 words.
- All images, graphs, and screenshots from external sources should be fully referenced, and ensure to include your username on your own screenshots.
- Use the tag #reminiscence01-S3week4 #cryptoacademy and your country tag among the first five tags. Also include other relevant tags like #Chart #Candlestickpatterns #trading.
- Homework task run from Sunday 00:00 July 18th to Saturday 11:59 pm July 24th UTC Time.
- Only users with a minimum of 125 SP and having reputation above 50 are eligible to perform this homework task. Also, note that you must not be powering down.
The comment section is freely opened for suggestions and feedback on the lesson and homework task.
Saludos profesor, podría explicarme mejor la ultima pregunta, hay que realizar una operación de compra real?
Yes, you can carry out a real purchase if you wish.
Here is my entry
https://steemit.com/hive-108451/@drmax1/crypto-academy-season-3-week-4-or-homework-post-for-professor-reminiscence01-or-candlestick-patterns
Welcomed professor for this week. I will go through the lecrure and submit it soon
Thank you. I look forward to seeing your submission.
Sir my post wasn't cuated again
This is a repost link
https://steemit.com/hive-108451/@kelechisamuel/repost-crypto-academy-season-3-week-2-homework-post-for-by-reminiscence01-kelechisamuel
Kindly exercise patience. Your repost will be curated.
Hello sir, @reminiscence01 you skipped my repost without curation again
It's just 2days left sir
Please sur my post was graded 7/10 but nit curated my repost link
https://steemit.com/hive-108451/@joelmaxwell/3brgn4-cryptoacademy-season3-week2-homework-post-for-prof-reminiscence01
Dear professor sir,
Here My Homework Entry:
https://steemit.com/hive-108451/@aniksikder/steemit-crypto-academy-season-3-beginners-course-homework-for-week-4-candlestick-patterns-for-professor-reminiscence01-by
Engulfing is my favorite along with pinbar
Same with me. It is every traders dream to find them are major support and resistance areas.
Nice one prof...
Saludos estimado profesor aqui vuelvo a publicar ni tarea ya que no fue curada por steemcurator02. Agradeceria su atencion gracias..
https://steemit.com/hive-108451/@johana2021/29s3gr-steemit-crypto-academy-season-3-week-2-curso-para-principiantes-or-introduccion-a-los-graficos-velas-japonesas
Sir my homework for this week
https://steemit.com/hive-108451/@mustafaasif/crypto-academy-season-3-week-4-homework-post-for-prof-reminiscence01-candlestick-patterns