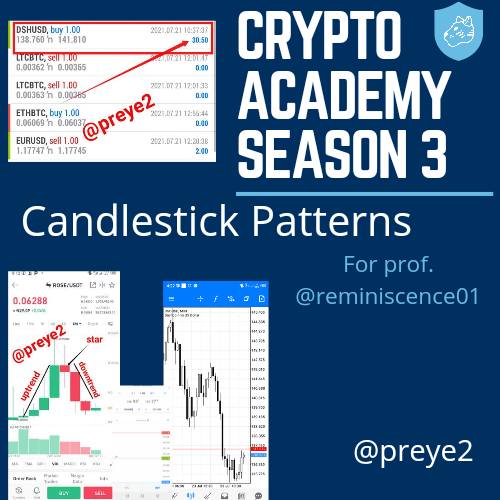
Crypto Academy / Season 3 / Week 4 - Homework Post for professor @reminiscence01 / by @preye2
Hello Steemians,
Here are the psychologies behind the formation of the following candlestick patterns

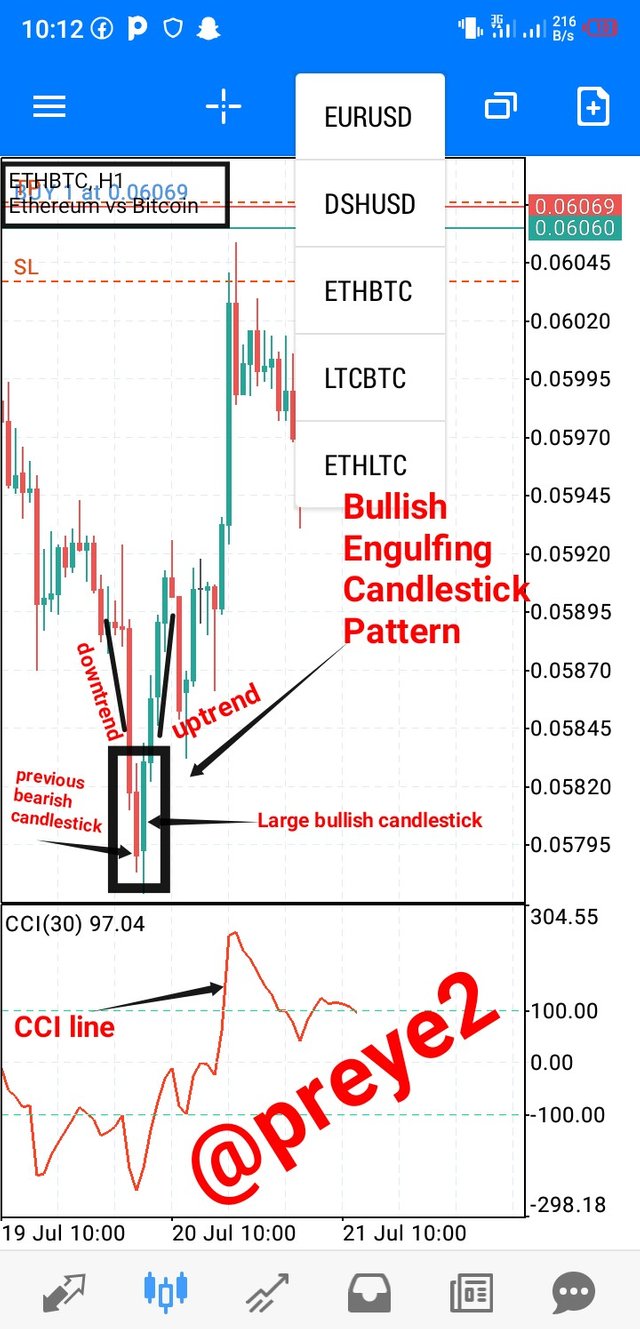
Bullish Engulfing Candlestick Pattern:
This is a two candlestick reversal pattern that indicates that a strong uptrend may likely follow, because the reversed bullish candlestick is larger than the previous bearish candlestick.
The psychology behind this is that traders have suddenly started rushing into the market to buy assets after selling some of their assets.
As you can see in the screenshot below, this is an ETH/BTC pair chart, with a 1 hour timeframe. After the bearish trend, there was a bullish reversal that continued for sometime. This means after the formation of the Bullish Engulfing Candlestick Pattern, there was an increase in price for a period of time.
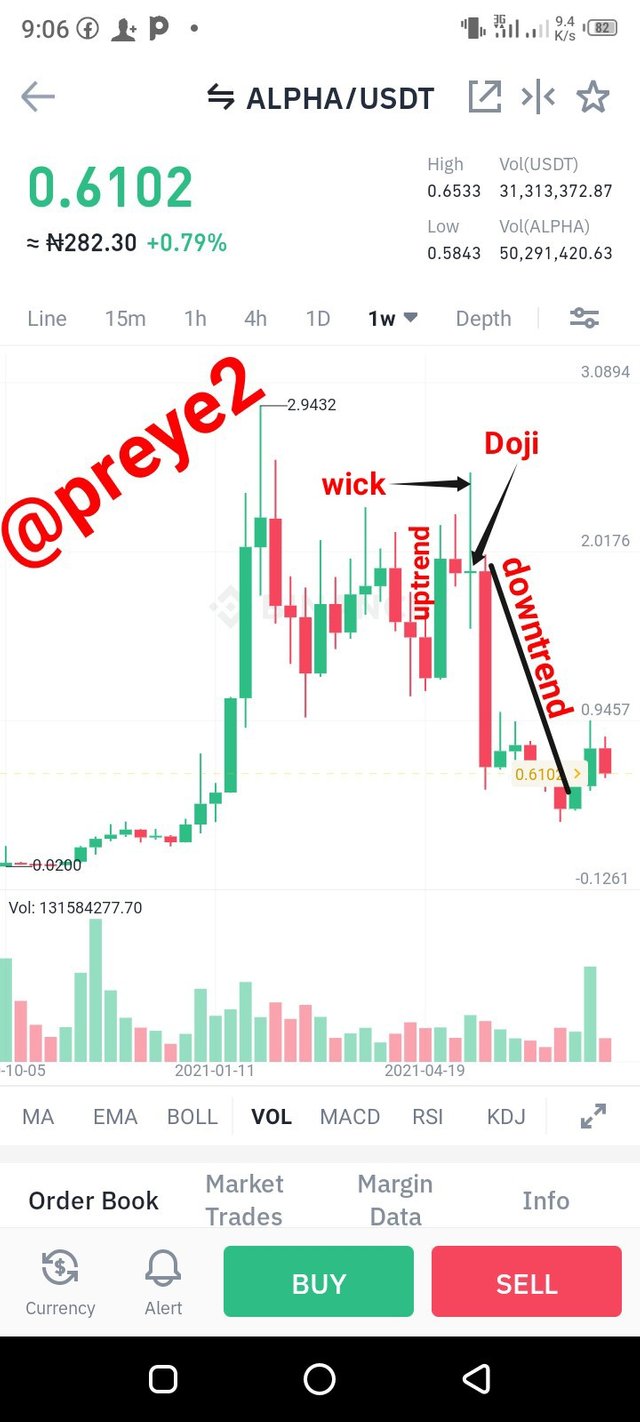
Doji Candlestick Pattern
This is a neutral candlestick pattern that indicates an indecision in a given market.
This doji candlestick patterns are usually made up of wicks with small bodies.
The psychology behind this pattern is that there is no fixed outcome on who is in control the market price, usually neutral.
As you can see in the screenshot below, this is an ALPHA/USDT pair chart, with a 7 days timeframe. After a little uptrend, there was a doji candlestick pattern, that indicated an indecision period in the market. And after the doji pattern occurred, there was a major downtrend in the market.
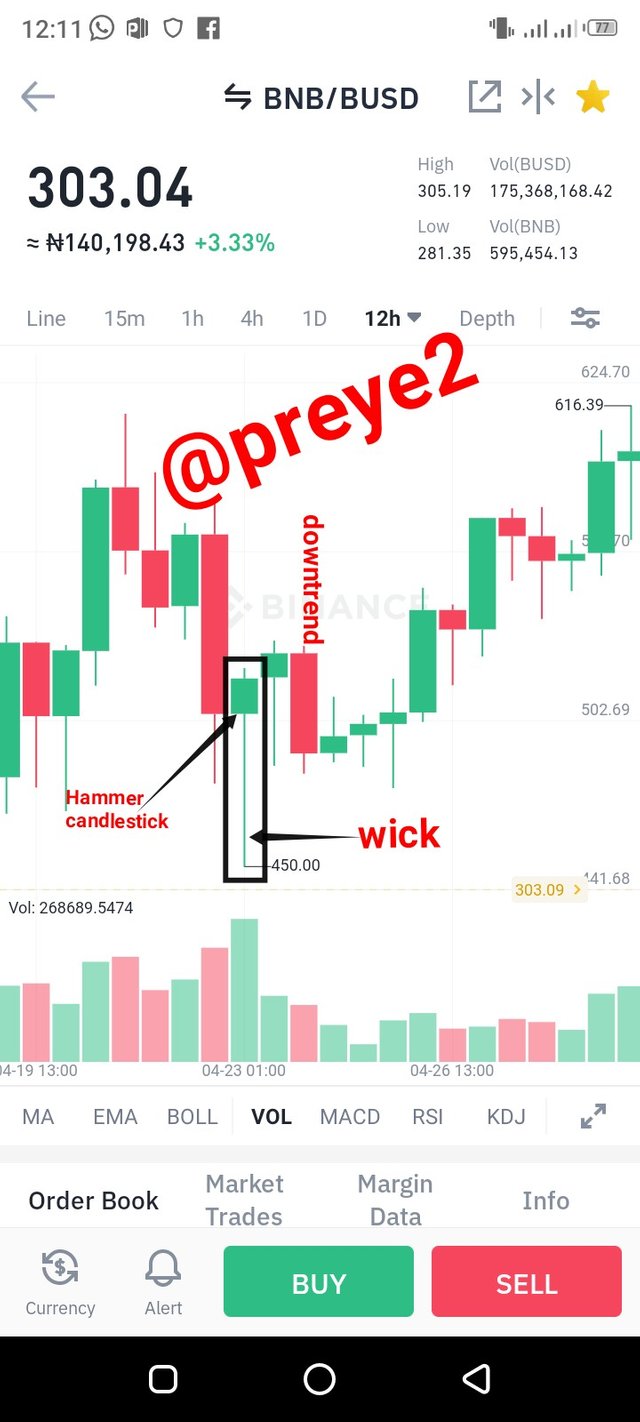
The Hammer Candlestick Pattern
This is a single bullish pattern that indicates a possible price reversal to the top. It usually signals that the present downtrend is coming to an end. And in most cases, after the hammer-like shape appears, the price begins to rise up.
The psychology behind this pattern is that the sellers were capable of reducing the prices but the buyers were capable of overcoming the selling pressure.
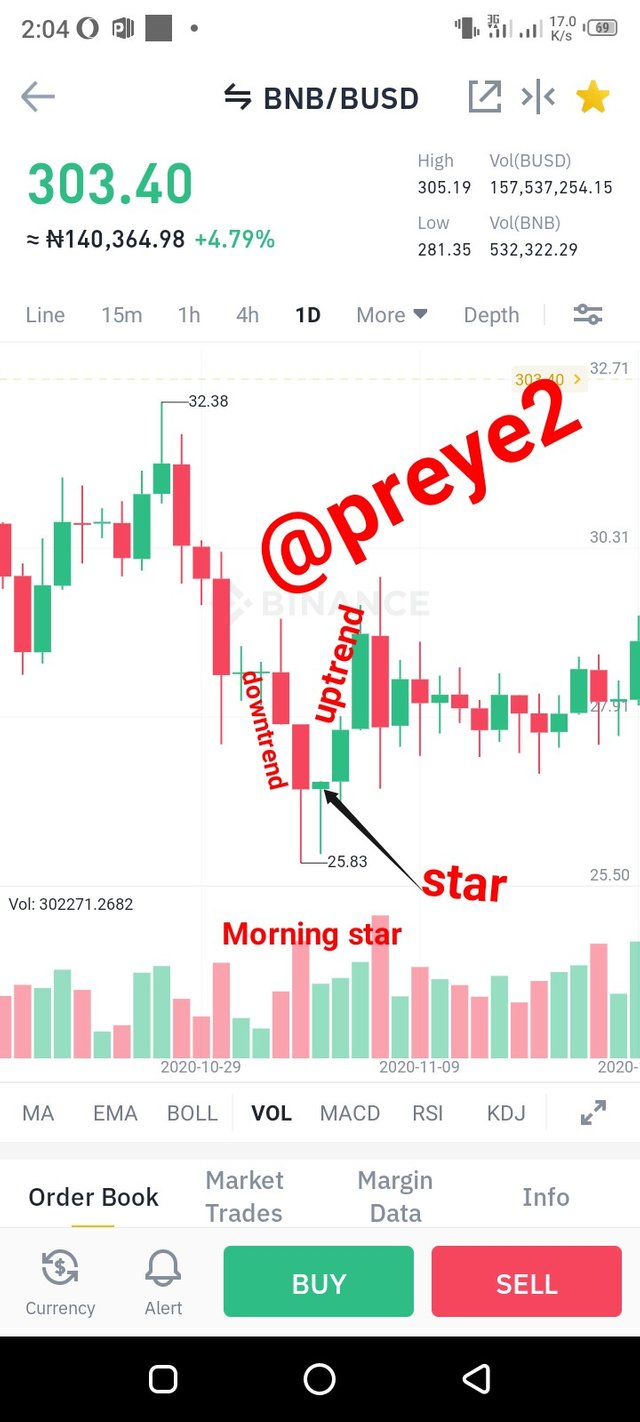
As you can see in the screenshot below, this is a BNB/BUSD pair chart, with a 12 hours timeframe. Immediately after the downtrend, there was an hammer-like shape that signals a possible uptrend. After the hammer candlestick pattern occurred, there was a little uptrend that followed.
The Morning and Evening Star Candlestick Pattern
The morning and evening star patterns consist of 3 candlesticks each.
The Morning Candlestick Pattern:
This consists of three candles, and they Includes;
1. A long bearish body
2. A small body at the bottom
3. And finally a long bullish body.
The morning Star candlestick pattern signifies reversal from a downtrend in price to an uptrend in price.
The psychology behind this pattern is that traders have sold alot of their assets and now they have began to buy more assets to balance their positions.
As you can see in the screenshot below, this is a BNB/BUSD pair chart, with a 1 day timeframe. After the downtrend in price, there was a small body (star) at the bottom, and then an uptrend in price.
The Evening Star Candlestick Pattern:
This consists of three candles, and they Includes;
1. A long bullish body
2. A small body at the top
3. And finally a long bearish body.
The evening candlestick pattern signifies reversal from an uptrend in price to a downtrend in price.
The psychology behind this pattern is that traders have bought alot of assets and now they have began to sell their assets for profit purposes.
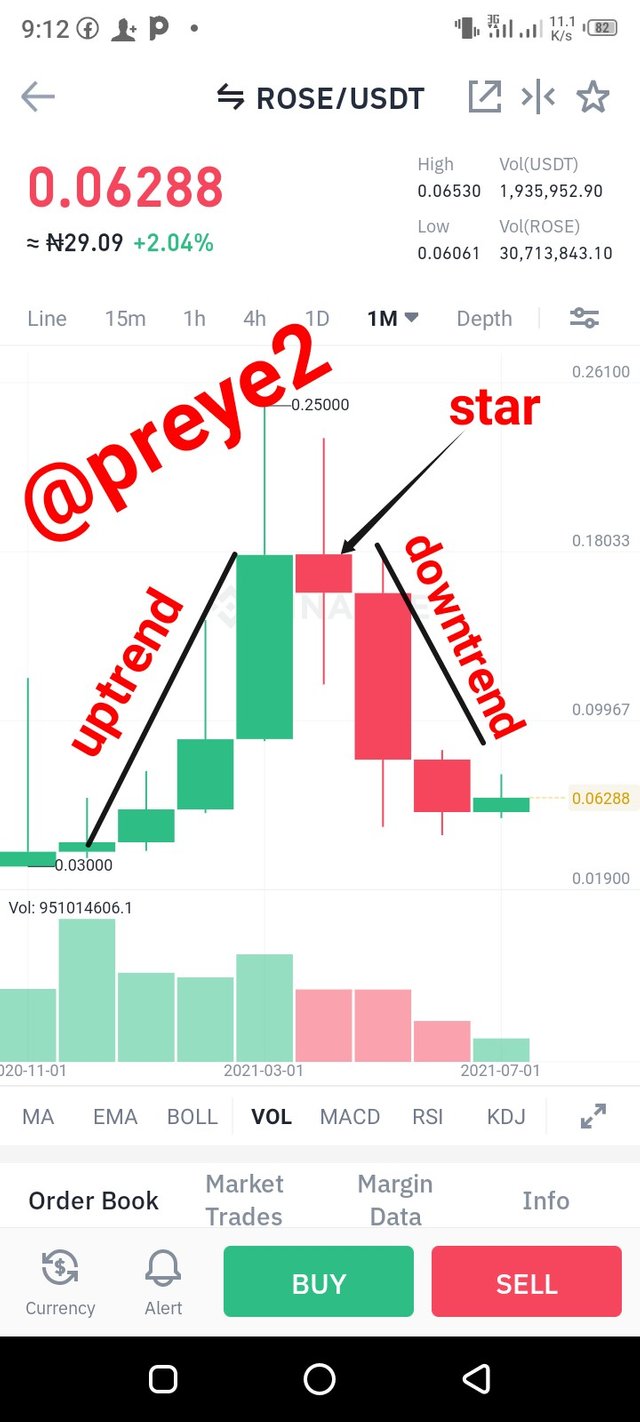
As you can see in the screenshot below, this is a ROSE/USDT pair chart, with a 1 month timeframe. After the uptrend in price, there was a small body (star) at the top, and then a downtrend in price.
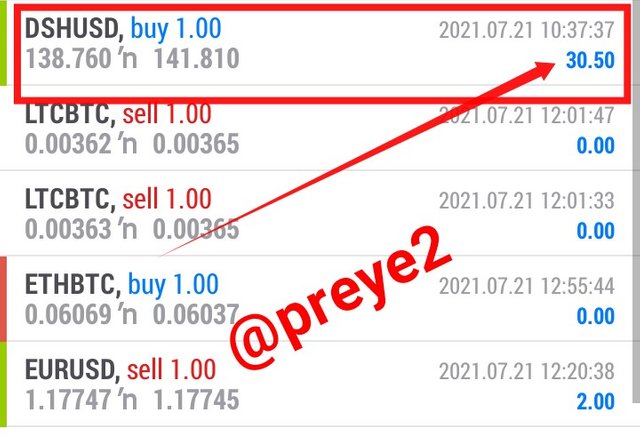
Using a MetaTrader 5 demo account, I will be opening a trade on DSH/USD pair chart.
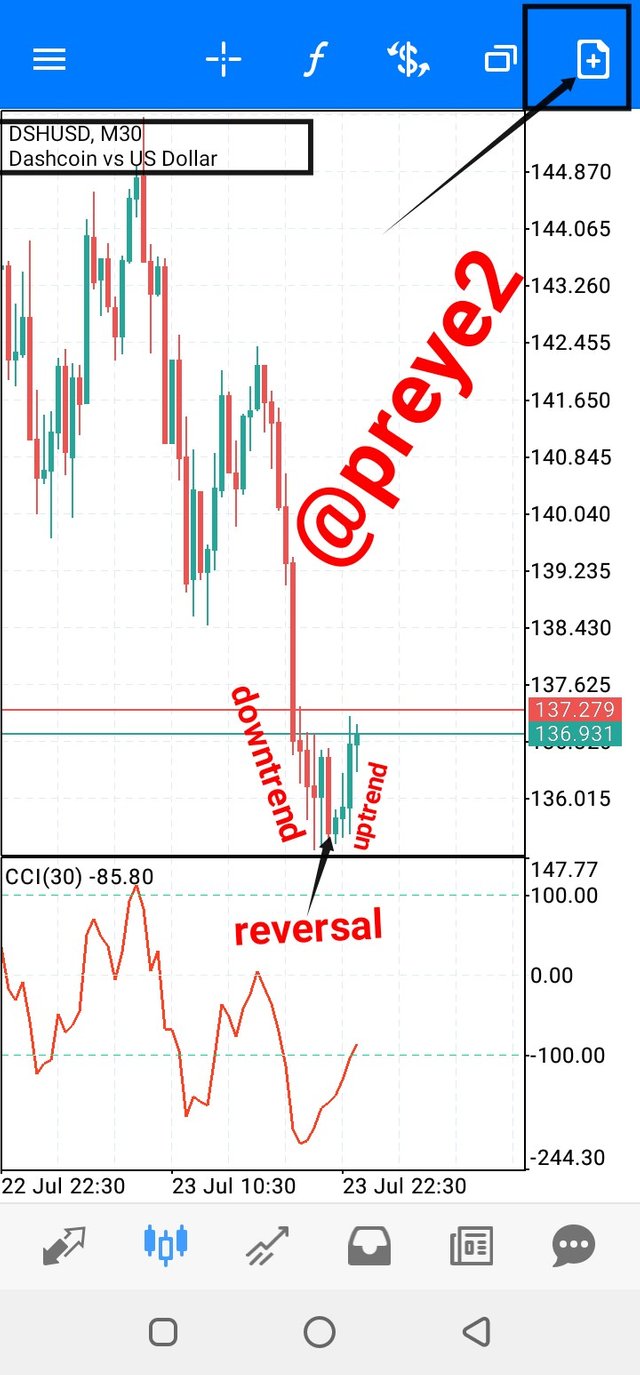
As you can see on the crypto chart above, this is a DSH/USD pair using a 30 minute timeframe. And I observed that there was a long downtrend, but a reversal has taken place.
So I will be using this uptrend as an advantage to opt for a quick profit, which means I will be making a buy order.
To place my order first thing I would have to do is to click on the plus (+) symbol at the top right hand corner of my screen.
And I had to set my Stop Loss and Take Profit, and then clicked BUY.
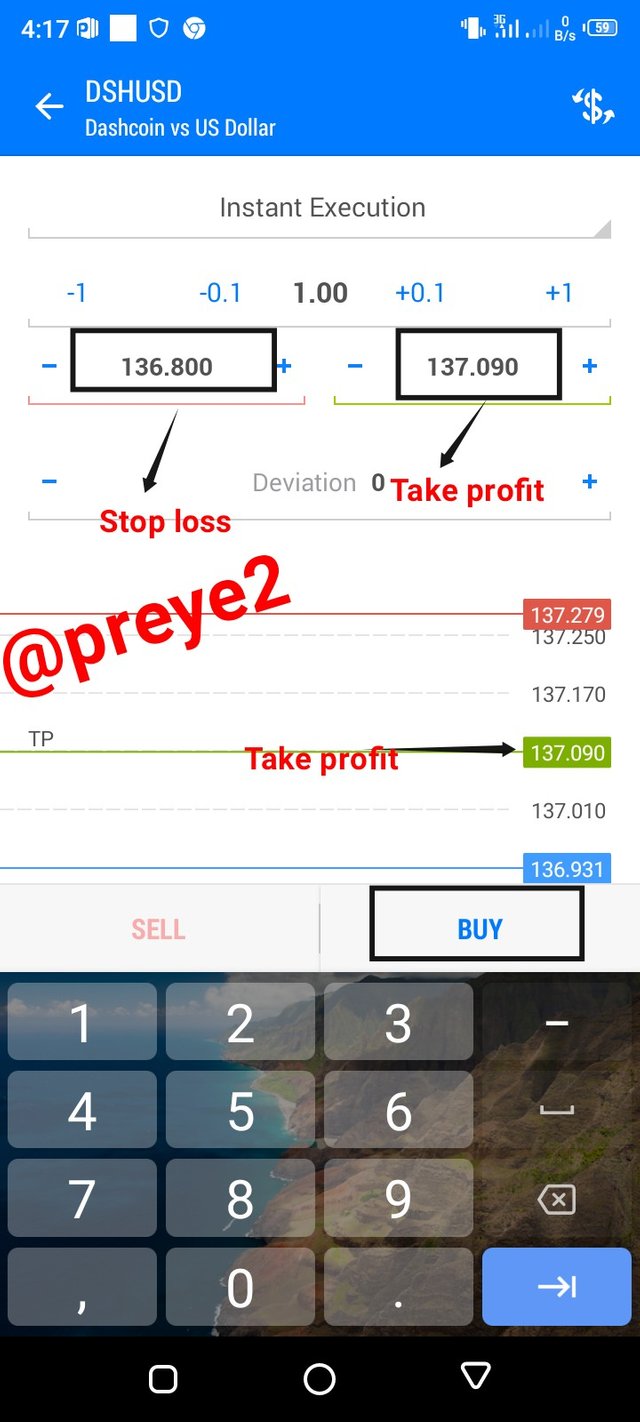
So when the trade gets to either of the lines it will be executed automatically.
At the end of my order, I was able to realize a profit of $30.50.
Conclusion
I want to conclude by saying the candlestick patterns are really useful to trend-following traders. All the various candlestick patterns are really important, provided you know how it works.
So am really grateful to professor @reminiscence01 for teaching such an educative lecture.
Hello @preye2, I’m glad you participated in the 4th Week of the Beginner’s class at the Steemit Crypto Academy. Your grades in this task are as follows:
Observations:
In this section, you didn't indicate the candlestick pattern you took the trade on. Anyway congratulations on your profit.
You have produced a quality content. You could have earn your full grade if you had completed the last section of the assignment.
Thank you for completing this homework task.
Thank you for the guidance respected prof. @reminiscence01, I really appreciate and I promise to improve next time