Steemit crypto academy:- season 3 week 1:- home work post for professor @kouba01
.jpeg)
So let's answer all the questions:-

1- What is the Ichimoku Kinko Hyo indicator? What are the different lines that make it up? (screenshots required)
Ichimoku kinko Hyo is indicator which tells us the present trend, movement, resistance and support as well as it is also used to predict the future trend, support and resistance. By using this indicator, anyone can see every detail needed to predict the price such as Trend, support, resistance, and future trend as well, on a single screen which is enough to make predictions and this makes this indicator so much popular and convenient to use.
.jpeg)
Ichimoku kinko Hyo indicator was invented by a Japanese journalist named Hasoda Goichi. Ichimoku kinko Hyo literally means the balance chart from one look which is not very easy to understand what it is.
When this indicator was invented before world war, it was quite famous in Japan and people were using it but still this indicator didn't reach to Europe before 20 years after its invention. The reason behind it was that the book containing it's information was written only in Japanese and wasn't available in English. But when it reached Europe many things were altered by European to make it fit for their use.
Ichimoku kinko Hyo indicator consists of five lines and these five lines are grouped in three groups:-
- Tenkan sen line
- kijun sen line
- Senkou span A
- Senkou span B
- Chikou span
1. Tenkan sen line:- or conversion line or fast line:-
Tenkan sen line is also called conversion line or fast line. Which is used to determine the volatility in price for a given period of time. In this average of highest high and lowest low for a fixed period is taken into account.
It is calculated by this formula:-
| (Highes high + lowest low)/2 |
|---|
For tenkan sen line this period is set for 9 days ( 6+3 days/ or one and a half week) by default but many trader changes it to another value according to their convenience.
This is the line with colour red in the chart. I am here sharing the price chart of BTCUSDT. I have exclude all the lines except this. So you can see the line clearly.
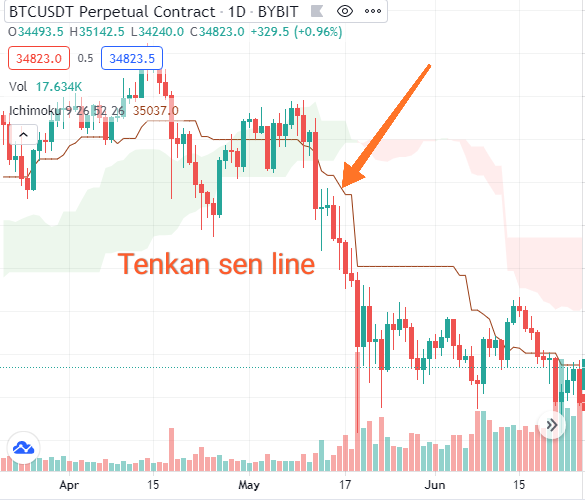
Tenkan sen line illustration in real-time
Kijun sen line or slow line or base line:-
Kijun sen line is also called slow line. It is used to determine the price volatility over a longer period then tenkan sen line.
In this too, average of highest high and Lowest low is taken into account but for a longer period of time.
Usually , this period is set to 26 days or 1 month (excluding Sundays) by default. But like for tenkan sen line, this period can be changed for kijun sen line too.
Formula:-
| (Highest high+ lowest low)/2 |
|---|
This is the line with colour blue in the chart. I am here sharing the price chart of BTCUSDT. I have exclude all the lines except this. So you can see the line clearly.
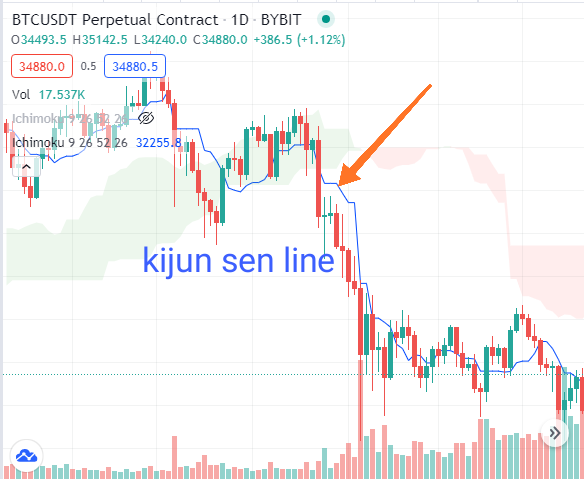
kijun sen line illustration
As both of these lines tells us the volatility but for a different period, these lined are usually grouped together
Chikou span or delay line:-
Chikou span which is also called delay line, tells us the closing price for 26 days or 1 month ( excluding Sundays).
This is the line with colour green in the chart. I am here sharing the price chart of BTCUSDT. I have exclude all the lines except this. So you can see the line clearly.
As this line doesn't have much significance as it tell only the closing point of the asset in the past. So many traders usually exclude this line in the chart.
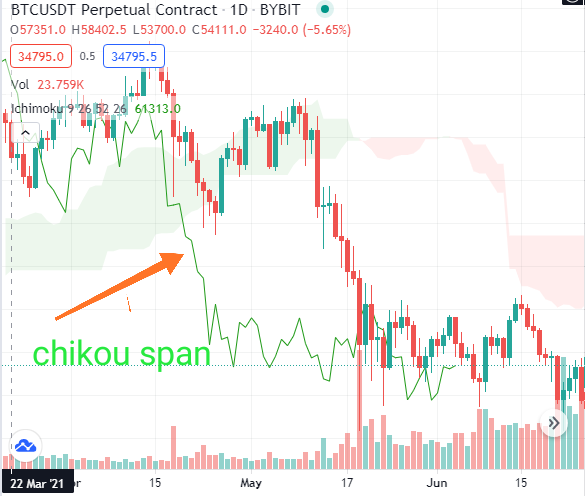
Chikou span Illustration
The Senkou Span A and the Senkou Span B
These two lines works together so these are discussed together here.
Senkou Span A and senkou span B which is abbreviated as SSA and SSB respectively are also called leading lines because these both lines are projected into the future.
Although the calculation for both these lines is different yet these both lines are used simultaneously.
- SSA is calculated by taking the average of tenkan and kijun for a period of 26 days and then it is graphed 26 days ahead.
Formula:-
| {(Tenkan and kijun) for a period of 26 days}/2 |
|---|
- On the other hand, SSB is calculated by taking the highest high and lowest low for a period of last 52 days and it is graphed such that it is also projected 26 days ahead In time.
Formula:-
| {(Highest high +lowest low): for a period of 52 days}/2 |
|---|
As the space between these two lines is coloured thus these two lines give rise to the formation of which is called cloud or kumo
SSA is denoted using green colour line and SSB is denoted using red colour line. And the space between these depends which Line is above.
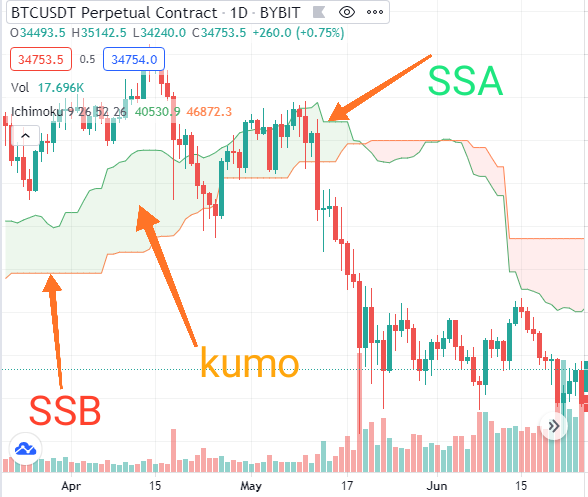
If the SSA is above then the cloud will be of green colour denoting bullish trend and if SSB is above the. Cloud will be of red in colour denoting bearish trend.
Because of having similarities, these 5 lines are grouped together into 3 group.
- First group consists:- tenkan sen line and kijun sen line
- Second one consists:- Chikou span
- Third one consists:- Senkou Span A and senkou span B.
2- How to add the Ichimoku indicator to the chart? What are its default settings? And should it be changed or not?(screenshots required)
To add ichimoku kinko Hyo indicator to the chart, follow the following steps;-
Go to tradingview site. And select your preferable pairs. For example I am here selecting BTCUSDT pair.
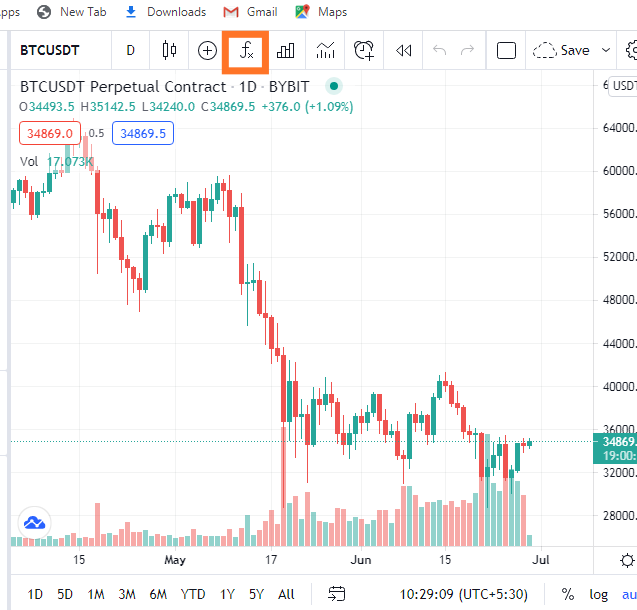
Now, click on indicators options which is abbreviated as f(x) here.
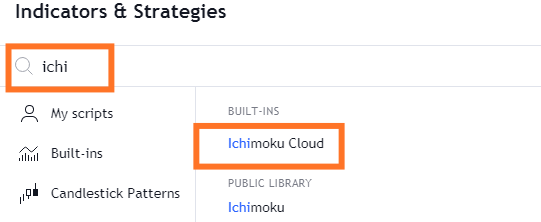
Now search for ichimoku indicator and then click on it.
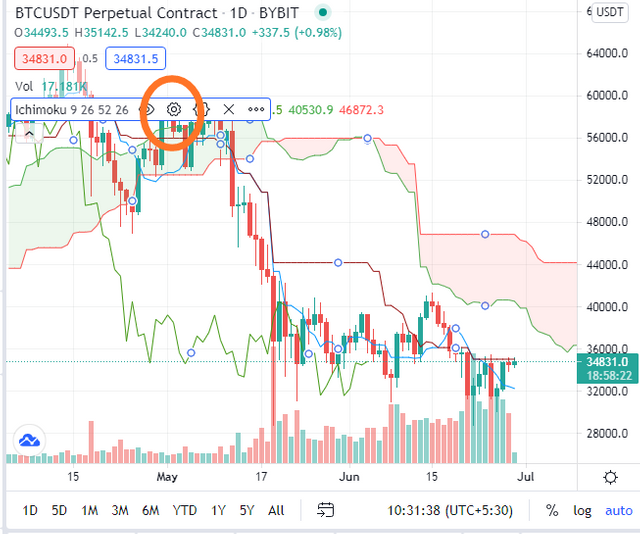
And after this, ichimoku kinko Hyo indicator will be added to the chart.
To see the default settings or to change settings, click on the graph and click on setting option
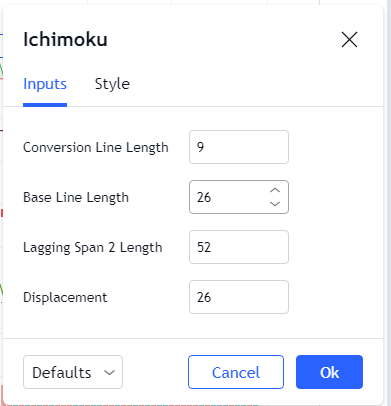
And there you can see that default settings are set to (9, 26, 52, 26). These default settings are very precise and these Should only be changed when you are trading for longer period or shorter period than usual. Provided that you are a professional trader.
But I will recommend everyone not to change it especially if you are a newbie like me.
How to use the Tenkan Sen line? How to use the Kijun Sen line? And How to use them simultaneously?
In ichimoku indicator there are many lines and every line has its own significance. In this section we will learn how to use tenkan sen line and kijun sen line seperately and simultaneously.
Tenkan sen line:-
Tenkan sen line is the average of high and low over a period of 9 days. It moves similarly to
SMA which is a abbreviation for simple moving averages. But as both are calculated by different formula so both of them are different indicator. But both moves similarly.
SMA is calculated by open and close point for a period of 9 days and then divided by 9. While tenkan sen line is calculated by taking the average of high and low for a period of 9 days.
Which is similar but not same. That's the difference between both of them.
Tenkan sen line tells us the trend of the asset. As it is the average of high and low point.
Along with this, the tilt of the tenkan sen line gives us the speed of the price movement. The more is tilt, the more will be price movement.
By observing the tenkan sen line, one can easily determine the resistance and support for any asset.
kijun sen line:-
Kijun sen line is the average of high and low point for a period of 26 days. And thus it is very useful for trader trading for short term and mid term.
By using this anyone can predict the price movement for short to medium period of time for any chart, and can easily predict the available opportunities such as entry point and exit point.
For example, if the current price of any asset is above the Kijun sen line then we can predict that in short to mid period, the price of the asset will go up. And we can buy the asset. Thus entry point can be identified
And similarly, if the price of below the Kijun sen line, this means it's time to sell asset and thus exit point can be identified
how to use tenkan sen and kijun sen line simultaneously
Although tenkan sen line and kijun sen line is having its significance seperately too, but these have much more importance while using these simultaneously
By using these both, one can determine the price trend of the asset and by using these with kumo, support price and resistance can also be determined:-
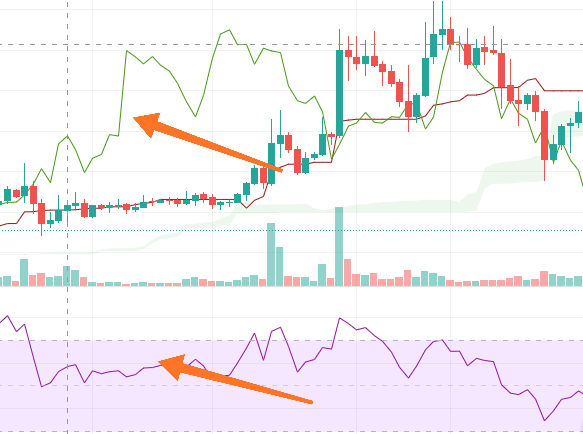
If tenkan line is crossing kijun sen line from below then it means there is uptrend and on the other hand if the lines is crossing kijun sen line from above this means downtrend.
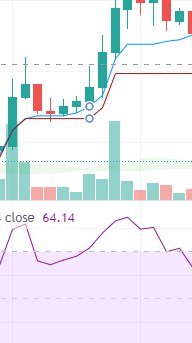
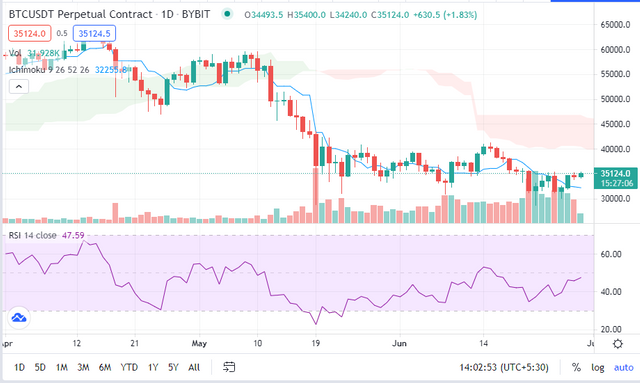
this is the price chart of BTCUSDT pair
What is the chikou span line? And how to use it? And Why is it often neglected?
Chikou span line is also called lagged span time. It is sometimes also called a photo from the past as it shows us the closing points of the last 26 days.
It has its significance role in determining the trend of the market.
For example:- if the price of the asset is higher than the chikou span line, this means the asset is having an uptrend.
On the other hand, if the price of the asset is below the chikou span line, then it means there is downtrend.
But still many traders ignore this line and there are many reasons for that. Some of them are listed below--
It has functionality only to tell us whether there is downtrend or uptrend. But this work can be done using the tenkan sen and and kijun sen line and that too precisely.
And as there are many lines already, to get clear picture and less distraction, many traders ignore this lineMany times when price chart of any asset become messy then chikou span line gives us false signal.
This statement is verified by the screenshot given below:-
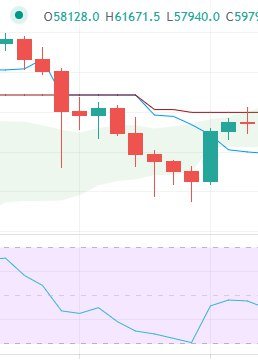
this is the price chart of steem/btc pair
As one can see that, chikou span line is giving signal that there is uptrend but at the same time you can see there is no uptrend in the market. Rather than the price of the asset is nearly constant but chikou span line is signalling for high uptrend.
So for these two main reasons many traders ignore this line.
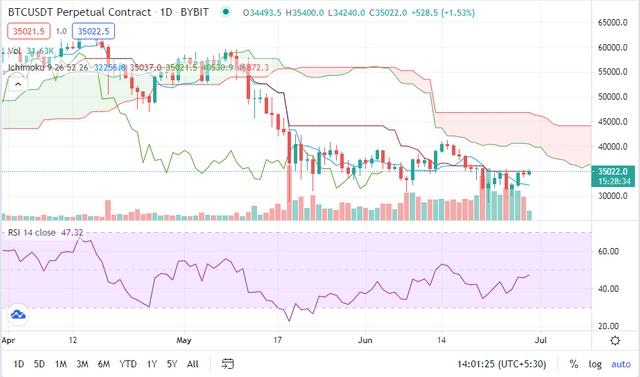
What's the best time frame to use Ichimoku? And what is the best indicator to use with it?
Ichimoku kinko Hyo indicator can be used with different time frames but the best time frame to use ichimoku kinko Hyo indicator is (9,26,52, 26) which is set by default, if you are not professional trader and a newbie.
But these time frames can be changed as per the need of the trader.
For example, if you are a long term invester and manking a investment for a very long term, then ichimoku indicator with bigger time frame will be ideal to use. And in this case time frame can be (10, 30, 60) or (20, 60, 120).
And on contract if you are a day to day trader them this Indicator with shorter time frame can be used.
And as we all know that no any indicator is 100 percent perfect. No any indicator can help you predict the exact future trend and price, so do ichimoku. By using this you can make predictions with very high accuracy but mot 100%.
So to minimize this risk and making the prediction more accurate, many traders use many other indicator along with this.
And if you ask me, I will go for RSI indicator. As ichimoku indicator is already very accurate but to ensure accuracy another indicator should be very easy to understand to make decision in less time.
As RSI is one of the most popular and easiest indicator. I will choose this to use along with ichimoku kinko Hyo indicator.
Conclusion
By using the ichimoku kinko Hyo indicator, we can see all the important things related to any asset on a single screen that too with high accuracy. Thus by using this indicator we can predict the price and can make decision very easily and quickly.
By using this indicator we can get the moving support and resistance price for any asset.
This indicator is much scientific as it involves both, the highest point and lowest point for a given period of time unlike very indicator which use the closing point for a given period of time.
By analysing the tilt of tenkan line we can easily determine the speed of movement of price for any asset.
As this Indicator is having 5 lines and it looks much hard to understand. But many trader claims that in pretty much less time everyone can get to this and can understand it very easily. Although I haven't used it before but I am now getting it already.
By using this indicator, one can easily determine the support, resistance, speed of Movement, uptrend, downtrend very easily
So this is all from my side. I hope I was well understood in this task. Thank you
You've got a free upvote from witness fuli.
Peace & Love!
@kouba01 professor my post is yet to be reviewed. Please review it. Thank you.
It s Ok, we will check it soon.
Dear @prakhar9675
Thank you for participating in Steemit Crypto Academy Season 03 and making efforts to complete the homework task. You got 7.5/10 Grade Points according to the following Scale;
Key Notes:
These are indicator default settings, not the time frame.
We appreciate your efforts in Crypto Academy and look forward to your next homework tasks.
Regards
@cryptokraze
With due respect sir, I apologise for this but I misunderstood the question. I thought that time frame was asked for tenkan sen line and for others. But I knew the answer.
If you allow me I can make the changes. Please allow me
Sir, I have always added my username but this time i captured screenshot on my computer rather than on mobile where editing is easy. But I didn't know how to do it on computer. That's why I couldn't do it as this trading view site wasn't working well on mobile screen.
And with due respect sir, can I ask why I got only 2 out of 3 in originality so that j can improve myself. If it was showing plagiarism then I can assure you that this work is 100% mine and not copied and then pasted.
Thank you for your review sir.
@cryptokraze
Dear @prakhar9675
Originality is not always about the copy/paste thing. It is also about how you add your own touch to the homework as I suggested you should have added your username to the charts. You can do so by adding text option in Tradingview.
As you have done a mistake about understanding the time frame thing, it adds negative impact on the originality of the content.
Moreover, few of the content has similar things that are mentioned in the below article.
I understand that you are not doing copy/paste but see the above points I mentioned and you will definitely improve in your next tasks.
It is not about deducting the marks to show the strictness but it is all about mentoring the students, so they can improve and become the better version of themselves in crypto world.
I hope you understand
Regards
@cryptokraze
Thanks sir for this clarification. I will try my best to improve myself.
Thank you @cryptokraze. Sir
Have a nice day
@cryptokraze sir, my post was reviewed after many post posted after me was reviewed. And all those post are curated by @steemcurator02 team and mine is not .
So I am afraid it will curate or not. Help me sir.
Thank you
All the posts will be curated. Please wait for it.
CC : @kouba01
You have been upvoted by @sapwood, a Country Representative from INDIA. We are voting with the Steemit Community Curator @steemcurator07 account to support the newcomers coming into Steemit.
Engagement is essential to foster a sense of community. Therefore we would request our members to visit each other's post and make insightful comments.
Thank you