REPOST: Understanding trends - Crypto Academy / S5W1- Homework Post for Prof. @reminiscence01

1) a) What do you understand by a Trending market? b) What is a bullish and a bearish trend? (screenshot required)
In an uptrend, price normally close higher than the previous high price whiles in a downtrend price close lower than the previous low price.
The opposite of a Trending market is known as a Ranging market.
A Ranging market is where the price of an asset is moving back and forth between a higher and a lower price.
Bullish trend (Uptrend):
A Bullish trend is the upward movement of price in the market or on the chart within a period of time. In this case buyers take control of the market.
In a bullish trend there are many buyers or high demand for a particular asset in the market which results in a swift increament of the value of the asset in a period of time. The candlesticks pattern usually moves in an upward direction on the chart in a period of time to indicate the uptrend of the market.
An uptrend is noted with the formation of higher-highs and higher-lows which simply means the new high price becomes higher than the previous high price.
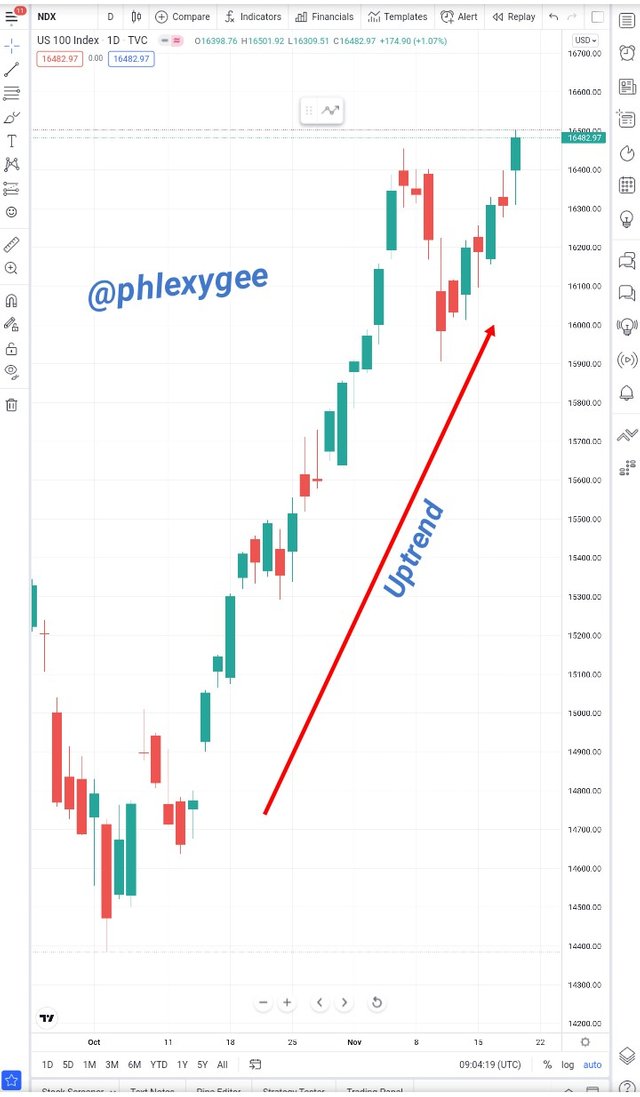
The above is a NDX chart and of course we can see the upward direction of the price which confirms the uptrend.
Bearish trend (downtrend):
A Bearish trend is the downward movement of price in the market or on the chart within a period of time.
The bearish trend is the adverse trend of the bullish trend and it is the condition whereby sellers take control of the market which leads to the asset's devaluation. The price of the asset falls within a period due to high supplies and less demand.
Over here the candlesticks pattern usually moves in a downward direction on the chart within a period of time which indicates the downtrend of the market.
A downtrend is noted with the formation of lower-highs and lower-lows which basically means the new low price becomes lower then the previous low price.
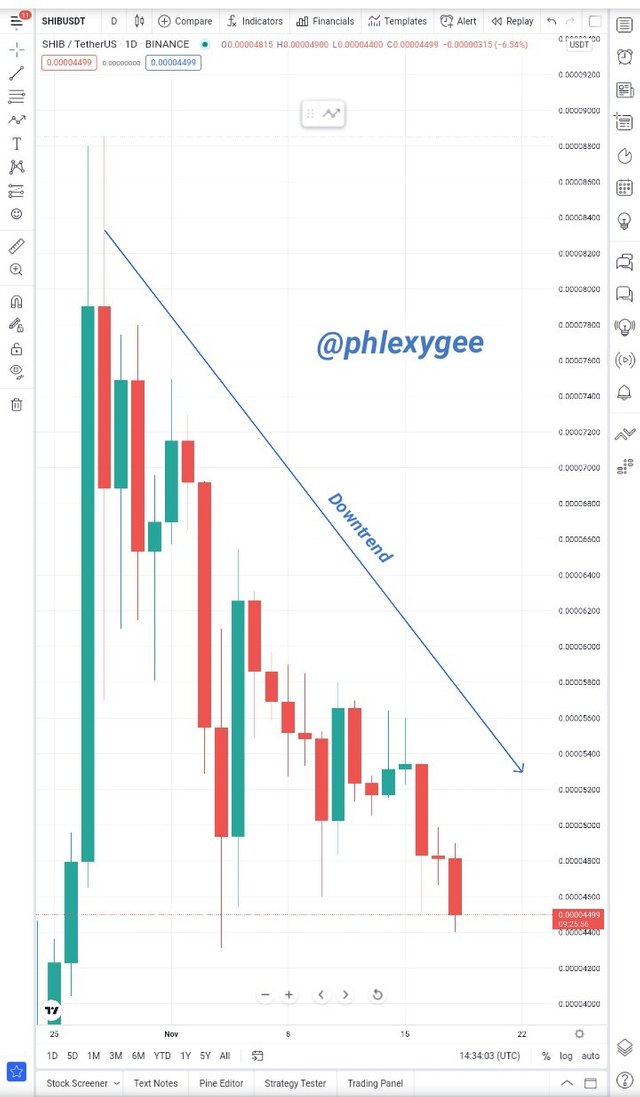
The above is a SHIBUSDT chart of which the price is moving in a downward direction (downtrend).

2) Explain the following trend identification and give an example of each of them. (Original screenshot needed from your chart). Do this for a bullish and a bearish trend. i) Market Structure. ii) Trendlines
i) Market Structure
The market structure is the formation of the candlesticks patterns on a market's chart which depends on the price and can be utilized to know or determine the trend of the market.
The market structure helps traders and investors to determine whether the market is in an uptrend, downtrend, or in a ranging by just glancing through the formation of the candlesticks chart or pattern.
The market structure normally corresponds with both the previous and current price of an asset.
A Bullish Trend Market Structure:
A bullish trend market structure, is whereby the price moves in an upward direction at a higher-high and higher-low price point which actually means the price do not move beneath the previous low-point and it also closes above the previous high-point. The bullish trend market structure is a sign that buyers have taken control of the market which of course leads to an trend. The bullish trend tends to be weak when the price fails to make additional higher-highs of which a trend reversal is bound to take place.
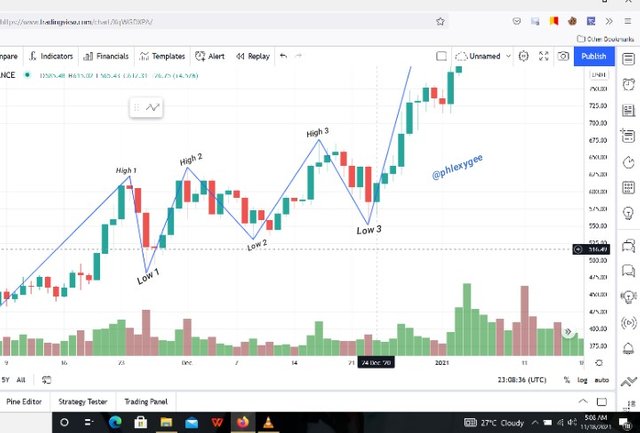
The Above image is a SHIBUSDT chart of a bullish trend market structure. As we can see the zig zag upward movement of prices on the chart.
A Bearish Trend Market Structure:
On the part of a bearish trend market structure, the market moves in a downward direction at a lower-high and a lower-low price points. Which means, in a bearish trend the new high price becomes lower than the previous high price and the new low price also becomes lower than the previous low price as well. In this case prices don't move above the previous highs and they close below the previous low prices. The bearish trend strength becomes weak when the price fails to make further lower-lows of which a trend reversal is bound to happen. In a bearish trend sellers are in charge of the market.
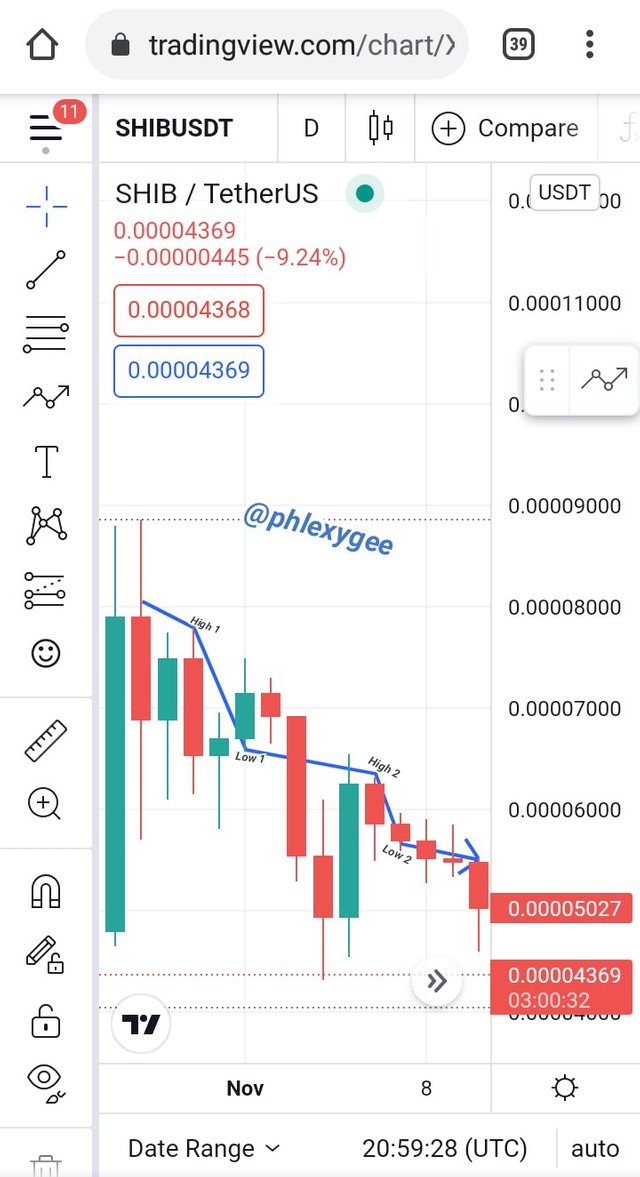
The above is a chart of SHIBUSDT of which the trend is moving in a downward direction which indicates bearish trend. Thus a zig zag movement of prices downwards
ii) Trendlines
Trendline is one of the technical analysis tools and it is a line which is drawn to join two low or high price points on a candlesticks chart. The trendlines are easily drawn by using two low points for an uptrend and two high points for a downtrend respectfully.
Trendline can be utilized for trend identification and it helps traders and investors to predict future market prices due to the movements of prices towards the line.
A market trend normally becomes invalid when the price breaks either below or above the Trendline with regards to the particular trend it was drawn to check. A trend reversal is bound to happen when there is a break of the Trendline.
A Bullish Trendline:
With a bullish trendline, the trading price of an asset stays above the trendline and when the price gets to the line it bounces back without breaking the trendline downwards.
Traders and investors need to take good notice of how price bounces back each time it hits the trendline because the trendline serve as an entry and exit point.
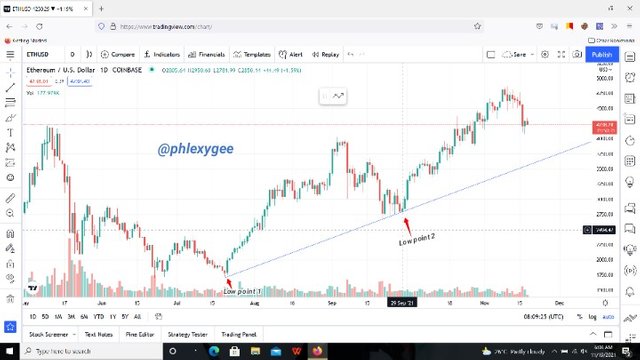
The above is an ETHUSD chart with a display of bulish trendline
A Bearish Trendline:
With a bearish trendline, the trading price of an asset stays below the trendline and when the price gets to the trendline it bounces back without breaking the trendline upwards.
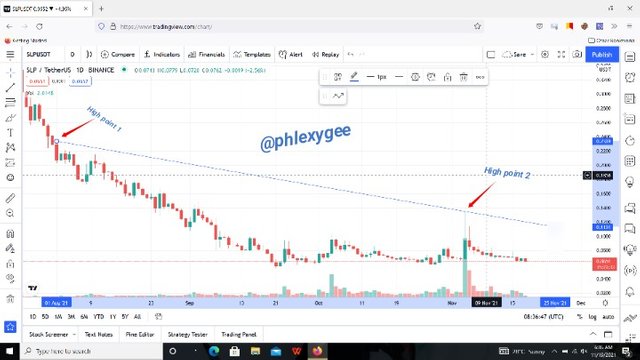
The above is a SLPUSD chart of a bearish trendline.
3) Explain trend continuation and how to spot them using market structure and trendlines. (Screenshot needed). Do this for both bullish and bearish trends.
Trend Continuation
Trend continuation is the retracement of price to its original trend after a short trend diversion. Trend continuation usually takes place when traders of an asset take-out their profits from the market at a particular point of time which pushes the price to return back to its original or previous direction and prepare for another wave.
Trend Continuation can be known by using the market structure and Trendlines.
Spotting Trend Continuation using Market structure
To spot a trend continuation by using a market structure, traders and investors should take note that price initiate higher-high and higher-low points in a trending market and after an impulsive move, there is a retracement for the price to continue in its original direction.
Bearish Trend Continuation:
In a bearish trend, the retracement creates a high point which is lower than the previous high and this simply means the buyers are not able to push the prices above the previous high which indicates that sellers are still in control of the price.
Traders and investors need to take note of the following two key points when considering a bearish market structure continuation.
During a retracement the high point must not get to the previous low point.
The new low point initiated must also be lower than the previous low point.
The above is a market chart of SHIBUSDT pair of which the trend is moving in a downward direction which indicates a bearish trend continuation.
Bullish Trend Continuation:
Traders and investors need to take note of the following two key points when considering a bullish market structure continuation.
The new low point must not be lower than the previous low point.
The new high point initiated must always be higher than the previous high point.
The Above image is a SHIBUSDT chart of a bullish trend continuation.
Spotting Trend Continuation using Trendlines
To identify a trend continuation by using a trendline, the trader need initiate and join two price points on the chart which are drawn to the future.
A Trendline serves as dynamic support and resistance in a trending market and the price retraces back to the trendline and gets rejected before continuing the original trend.
Bullish Trend Continuation:
For a bullish trend continuation, the trend goes in an upward direction and the price bounces back up after it hits the trendline in order to continue the bullish trend.
Price moves above the Trendline and a break of the Trendline downward gives a trend reversal signal.
The above is a ETHUSD chart with a display of bulish trend continuation which is identify by a bullish trendline.
Bearish Trend Continuation:
With a bearish trend continuation the trend moves in a downward direction and the price moves below the trendline and when the price hits the trendline it bounces back without breaking the trendline upward. Price stays below the Trendline and a break of the Trendline upward gives a trend reversal signal.
The above is a SLPUSD chart of a bearish trend continuation which is indentified with the help of a bearish Trendline.
4) Pick up any crypto-asset chart and answer the following questions - i) Is the market trending? ii) What is the current market trend? (Use the chart to back up your answers).
I have chosen a SHIBUSDT chart as shown above.
i) Yes, the market is trending as the structure displays (the price is moving from an upward to a downward direction).
ii) Currently the market is in a downward direction which indicates a downtrend (bearish trend) with lower-high and lower-low prices.
All the charts are screenshots taken from www.tradeview.com
Conclusion
An Uptrend means buyers are in control of the market whiles a downtrend is a sign for the dominance of sellers in the market.
Therefore the right knowledge about the market structure and trend is very important because the trend of the market has significant influence on traders and investors trading outcomes.
Trendlines and market structure should be properly utilized together with other technical analysis tools in order for traders and investors to get the best out of the market.
There in no technical analysis tool that provides 100% accurate results therefore there is the need to employ the best tools that suits the trader's style of trading.
Thank you Prof. @reminiscence01 for such a great lesson.
Hello Prof. @reminiscence01, here is a repost of my last week homework that you marked but it wasn't curated and the post has expired.
The link