Steemit CryptoAcademy Season3 Week3 Homework Task for @lenonmc21-Dynamic Course for Beginners | about Trends ,Support and Resistances and simple Chart patterns.
INTRODUCTION
It’s a great pleasure to participate in this homework task .great appreciation go to @lenonmc21 for coming up with this wonderful class about trends,trend lines and chart Patterns
1 .Define in your own words what is a "Trend" and trend lines and what is their role in charts?
WHAT IS A TREND
- A trend is when price movements begin to flow in one direction there by market investors investing there money in the same direction. for-example the market investors investing in the same crypto currencies in the market.
Trends are divided into two parts and these are as follows
DOWNTREND
- The downtrend is also referred to as the bearish trend
In the downtrend, price movements are lower indicating that the sellers are more strong compared to the buyers. The bearish trend is always red in color and it closes at the bottom - The red color represents sellers and the down-movement of prices in the market .
UPTREND
- The uptrend is also referred to as the bullish trend
In the uptrend,price movements are higher implying that the buyers are more strong compared to the sellers. The bullish trend is always green in color and it closes at the top. - The green color represents buyers and the up movement of prices in the market.
What are trend lines
First and foremost in the trend lines , the lines that one has drawn in the trend chart help them to know in which way the price of an asset will go next .
The trend line also helps to a give a best view of the direction of the price movements.
Trend lines
These are lines drawn connecting to specific data parts showing specific direction and speed of prices
These trend lines are drawn under the low pivots or over pivot high to show the specific direction of the prices .
We have got two trend lines which include,
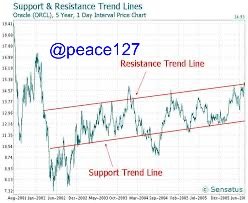
A resistance trend line
This is a line which helps investors to identify the price trend movement of specific stock
In resistance trend line , the prices stops rising and go back down
Support trend line
These are lines where the prices stop falling and go up or rise up.
The following are the roles of trends and trend lines in the chart.
Roles of trends in the chart
The trend shows the direction of the price movement in the market . Therefore by the help of the trend, the investors get to know when to buy or when to sell when they read the trend and analyze it
The trend helps the market traders to invest there money in one direction
The trend helps investors to choose a price direction with least resistance.
When the trend is up , this implies that the market players rate of buying assets is very high indicating a bullish trend and when the trend goes downward, this implies that the market players rate of buying assets is very low indicating a bearish trend.
Roles of trend lines
Trend lines help to show the market players the specific direction of prices on the trend chart
The trend lines that one has drawn in the trend chart help the market players to know in which way the price of an asset will go next .
Trend lines help the market players to predict when the prices are high and when the prices are low by analyzing the trend chart.
Trend lines give a clear view of the trends in the chart market.
2 .Explain how to draw an uptrend line and a downtrend line (Show a screenshot of each).
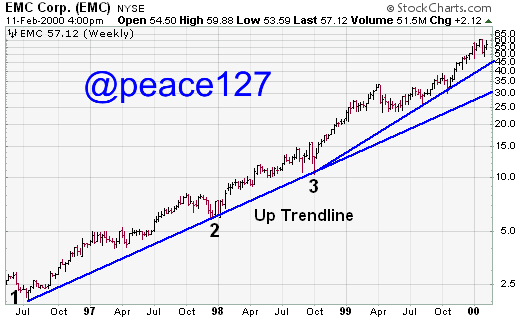
UPTREND LINES
- Uptrend line refers to a line that is drawn upwards to the right connecting to two or more low points.
In uptrend even when the prices are high or rising, the trend indicates that there is more demand than supply. In uptrend you connect a series of chart low points sloping upward to get a straight line hence forming an uptrend line
Therefore, the two or more points identified on the trend chart will help the market players to draw a straight line hence indicating uptrend line
Downtrend line
- A down trend line is a line which connects a series of high points of a chart slopping downwards.
Therefore when you draw a straight line and it touches on the points of resistance, then the line that has been drawn on the points of resistance indicates a downtrend.
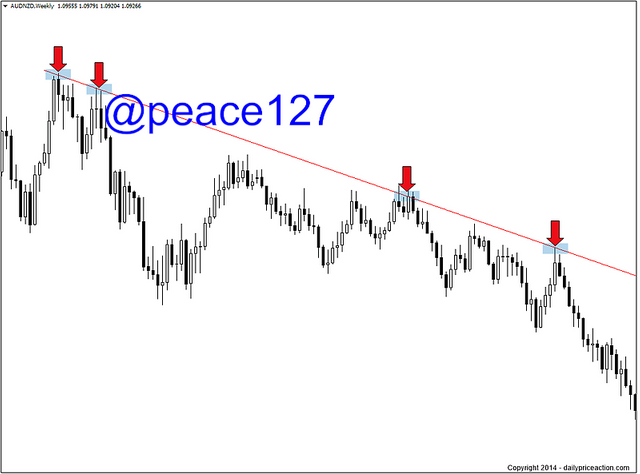
The downtrend fluctuates over time as it moves lower in prices . The the down trends are always lower.
3 .Define in your own words what "Supports and Resistances are and how we can identify both zones (Show a screenshot of each one).
- First and fore most supports and resistances are the best concepts in trading that’s to say market traders should be well versed with both these concepts before they can go to trade.
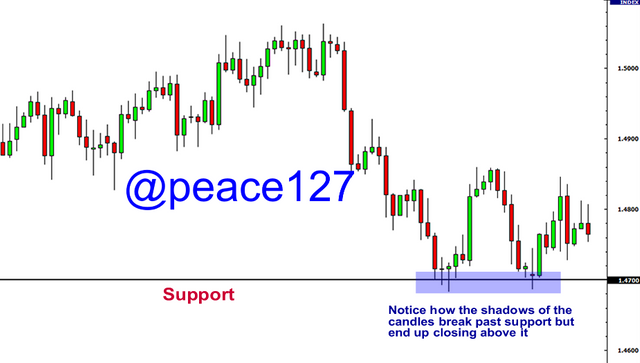
What are supports
Support refers to prices on charts that do not accept the price of an asset to be moved downwards.
Support is a price level where a downtrend pauses permanently due to attentiveness on demand.
When demand increases, the prices of various assets being traded reduces hence leading to the existence of a line known as a support line.
Supports may happen where a downtrend pauses permanently due to maximum attention on demand . Support can be analyzed on charts using trade lines.
In support, traders get to know whether to carry out trade or not to trade.
What are resistances?
Resistance may happen where an uptrend tends to pause temporarily due to maximum attention on supply. Resistance can be analyzed on charts using trade lines.
In resistance levels, markets trend upwards
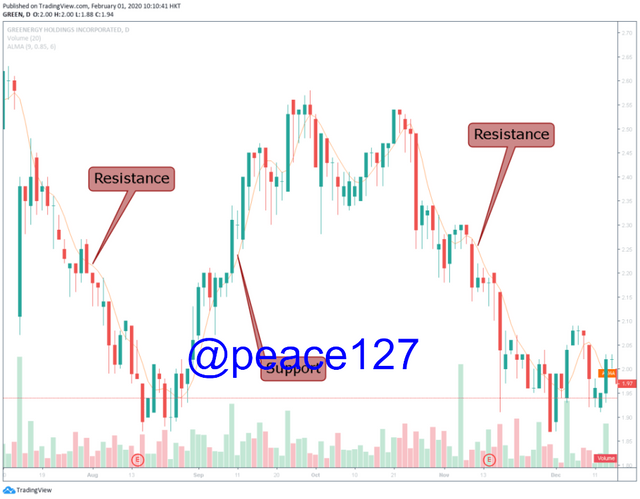
How we can identify both zones
This can be done by the use of a line known as the horizontal line
You can identify both the support and resistance zone by picking any trade chart that you prefer you can use a line chart and then identify all the highs and lows in the chart and mark them so that it can be easy for you to draw a horizontal line.
Draw a line connecting to the highs and lows that you identified or marked earlier to form a horizontal line hence making a support and resistance zone.
Support zone
Resistance zone
source
4 .Explain in your own words at least 2 simple chart patterns with screenshots.
There are many chart patterns but i will only be explaining only two chart patterns and these include the following
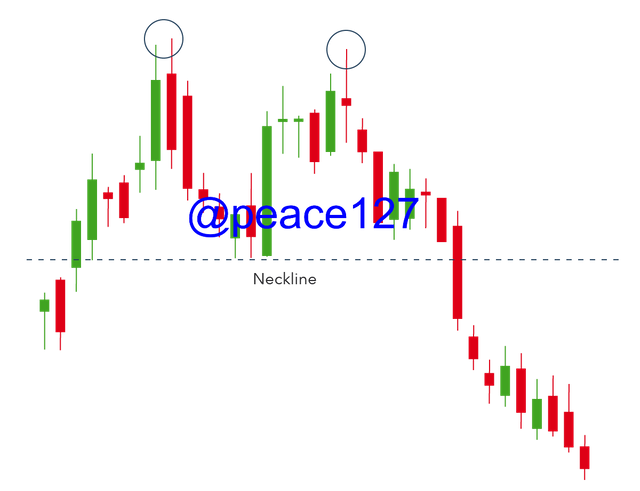
Double top chart pattern
The double top chart Pattern always show when there is any change in the trend
In the double top chart pattern there is more selling than buying of traded assets.
A double top chart pattern can also be known as the uptrend pattern
Before assets go back to the support level, the price of an asset will experience a peak therefore it will move upwards again before going down again permanently . The double chart pattern forms a first stop and then later a second stop is formed before the market prices decrease.
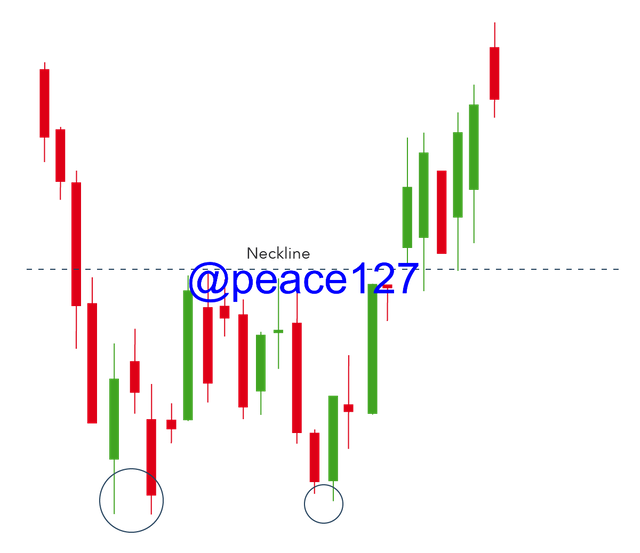
Double bottom chart pattern
This indicates an end in downtrend and movement to an uptrend
The prices of assets reduce below the support level because it’s time for selling rather than buying therefore before the prices drop, they first rise to the level of resistance therefore there will be an up-word movement in the market due to the reversal of the trend
In conclusion, trends have simplified the work of market players because invest there assets in the same path and it helps them to know when to buy and sell the traded assets .
The trend lines also help market investors to know when they should trade or should not trade by analyzing the trend lines.
Thank you professor for this wonderful class study and this my own understanding about the mentioned above topic
Nice work.
Thanks dear waiting for you to participate
Am making my entry today dia