[Understanding Trends] - Crypto Academy / S5W1- Homework Post for @reminiscence01
Hello dear friends;
Today, in the first week of the new season, we have covered a very basic subject that everyone who is interested in the stock market, cryptocurrencies, or any investment tool should know very well. I would like to thank my dear professor @reminiscence01 for this useful and important lesson. Let's answer our questions within the scope of this task without further ado.

1) a) What do you understand by a Trending market?
In technical analysis, we try to make price predictions for the future by tracking the past movements of the price. It is also a highly preferred method to follow trends for these forecasts. There are three directions in which the price can move in a market. Either it moves in a fixed range, this situation is called the ranging market. Or the price movements will be up or down. In this case, the market is in the trending market phase.
The trending market is divided into two as Uptrend and Downtrend.
We can use trends for all commodities. Since this is the Crypto Academy, our focus is on cryptocurrencies and we can use it in the crypto markets of trends with peace of mind. In fact, the first thing we look at when looking at the price movements of a cryptocurrency is usually the direction of the trends.
I will explain in more detail in the following questions, but here I would like to briefly talk about the terms uptrend and downtrend. In the trending market, if the prices tend to rise compared to the previous movement, there is an uptrend. Conversely, if the trend direction is moving downwards, that is, if the prices are in a downward trend compared to the previous movement, then there is a downtrend.
When the trending market is carefully analyzed, it gives us serious clues about the state of the market, whether the market is mainly buying or selling, and what will be the expected price action from now on.
b) What is a bullish and a bearish trend? (screenshot required)
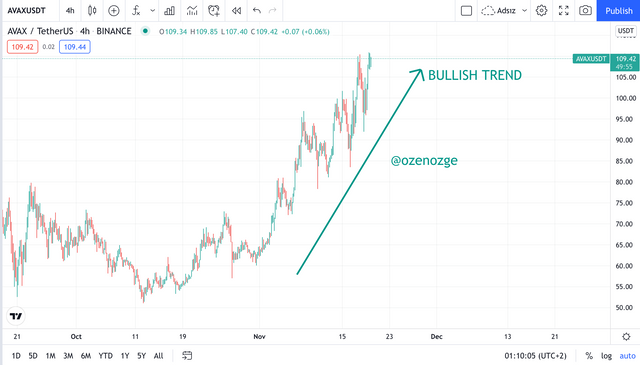
If we are talking about the existence of a bullish trend in the market, the price action should be upwards. In other words, prices are expected to increase in the next stage. In the presence of a bullish trend, the psychology of the investors is positive. Investors prefer to invest in the relevant cryptocurrency. or if they have this cryptocurrency, they prefer to keep it.
In the example below, the Bullish Trend of the AVAXUSDT pair is presented as an example.
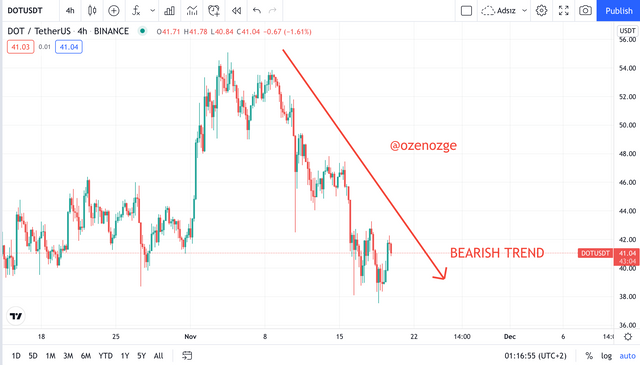
In Bearish trend formation, there is a negative atmosphere in the market. Prices show a downward trend. For this reason, investors fear that the value of their cryptocurrencies will decrease. Generally, when this trend occurs, investors tend to sell the commodity they own.
In the example below, the Bearish Trend of the DOTUSDT pair is presented as an example.

2) Explain the following trend identification and give an example of each of them. (Original screenshot needed from your chart). Do this for a bullish and a bearish trend.
Market structure is used to predict what prices have done in the past and, accordingly, how they will behave in the future. In other words, it helps us to interpret the current state of the market. The market can be bullish or bearish, or Ranging. Thanks to the market structure, we can understand which phase the market is in.
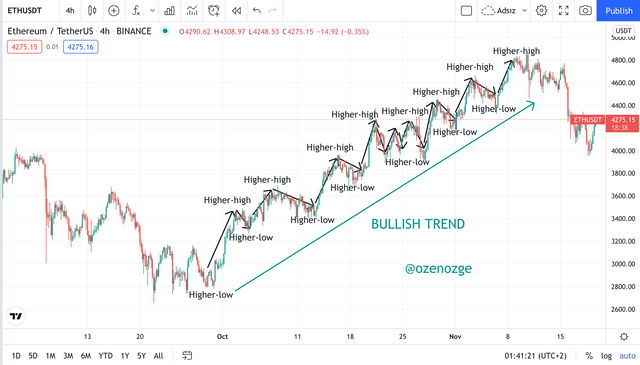
We observe that higher-high and higher-low formations are formed in the Bullish market structure. In this way, the price shows an increasing trend in general. In this structure, it is seen that the price decreases from time to time in order to correct it. Experienced investors realize that this is a higher-low formation and do not worry. Or, there are opportunities to make small gains by using these formations.
The ETHUSDT chart given below shows that the market structure is a Bullish trend. Also, higher-high and higher-low formations are shown on the chart.
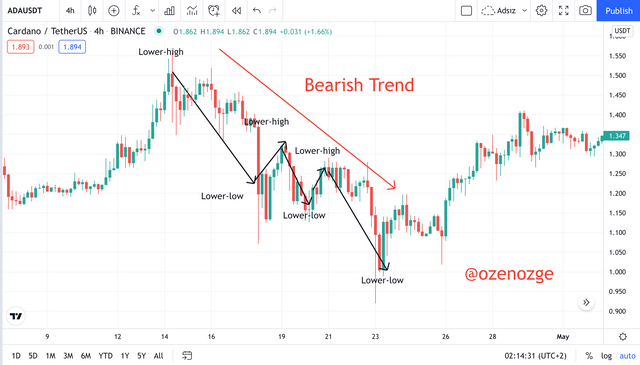
Market structure can also be a Bearish trend. In this case, contrary to the Bullish trend, the prices show a gradual decrease. In this structure, lower-high and lower-low formations are observed. Here again, experienced investors can follow these lower-high and lower-low formations and gain profits from them.
The ADAUSDT chart given below shows that the market structure is a Bearish trend. Also, higher-low and lower-low formations are shown on the chart.
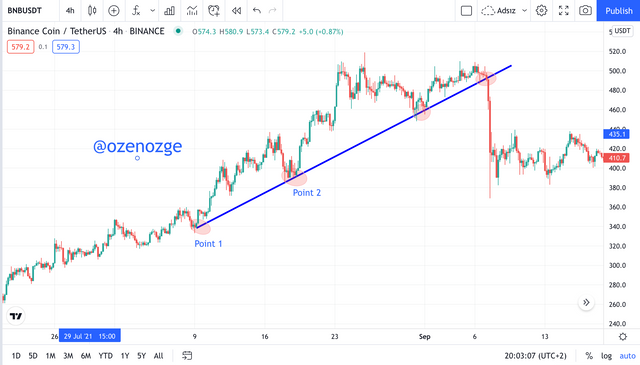
Another method we can use to understand whether price movements are increasing or rising while trading is to draw trend lines. A straight line passing through two points touching the candlesticks helps us determine the trend direction. If the first of the two points touching these candlesticks is lower than the second, it means that prices are increasing. In other words, a Bullish trend line has been drawn. Conversely, if the first point is higher than the second, the price tends to fall, so this line is a bearish line.
The point to be considered while drawing a Bullish Line is that the trend line should be drawn at the bottom of the candlesticks. Of course, I don't need to point out that the prices are in an increasing direction.
In the chart below, a Bullish line is drawn above the BNBUSDT pair. As can be seen in the graph, the price increase continued along the trend line. After the trend line was broken to the downside, the price decrease was observed.
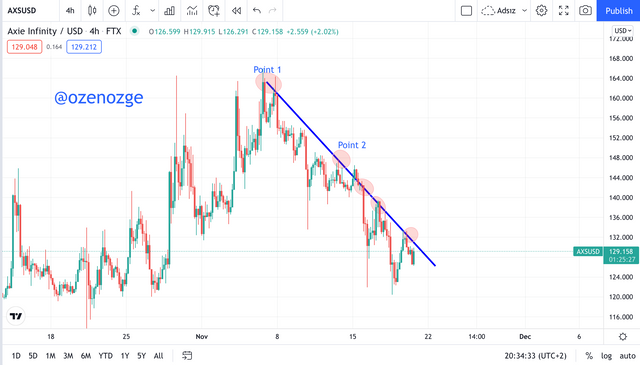
While drawing a bearish trend line, this line should touch the candlesticks from the upper point. Here, the price appears to be in a decreasing trend. After the prices break the chart upwards, it is expected that this decline will end and the price will increase.
The chart below shows a bearish line drawn on the AXSUSD pair. The continuation of the downtrend is likely to falter as prices have not yet broken the trendline.
3) Explain trend continuation and how to spot them using market structure and trendlines. (Screenshot needed). Do this for both bullish and bearish trends.
In the market, we cannot see prices constantly rising or falling flat. There will always be ups and downs. Investors take profits with these price corrections and thus ensure the continuity of the trend.
You must have seen that sometimes the price touches the resistance point and the price is tested from this resistance. Price will test this resistance point a few times. At this point, if we can interpret the trend continuation correctly, we can interpret whether the trend will continue or not.
We can use the market structure and trend lines that we learned in the previous parts of our lesson to confirm the trend continuation.
Let's start with the market structure first.
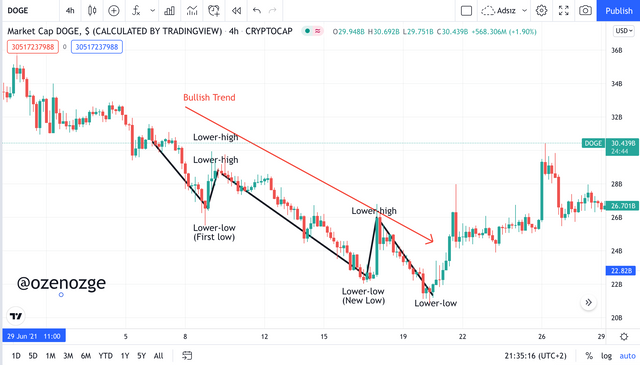
If there is a bearish trend, prices show lower-high and lower-low formations. Lower low formations show the price decrease, while in the lower high, the market corrects. Investors can earn profit by selling what they buy at lower lows at lower highs. The important thing here is that the peak formed by the lower high should be lower than the previous lower high.
You can see these formations in the DOGEUSDT pair chart below. The tendency to buy at the lower-low point and to sell at the lower-high point is high.
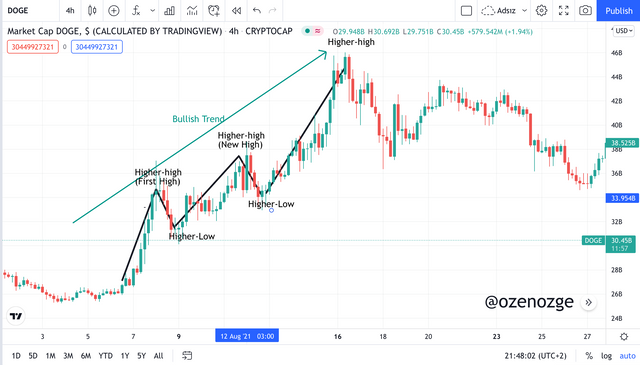
In Bullish trend contination, higher high and higher low formations are formed. Here, the expectation is the formation of new higher high formations. Examples of these formations are given on the DOGEUSD chart.
Trendlines actually act as support and resistance points. When these prices break these trend lines, it is an important indicator that the trend direction will change.
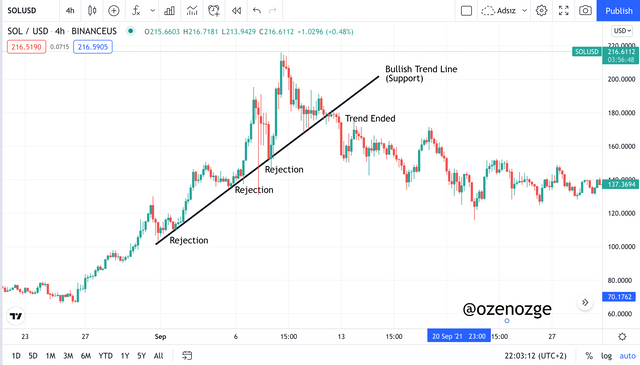
Let's first examine the Bullish Trend Line. Bullish Trend lines can be considered as supports. As long as the trend continues, higher-low points usually hit this support point and test the trend. If the price starts to rise again after falling to these support points, the Bullish trend is continuing. But if it continues to decline after touching the trend point, that is, if it breaks the support, it means that the trend has weakened or ended. Care must be taken at this point.
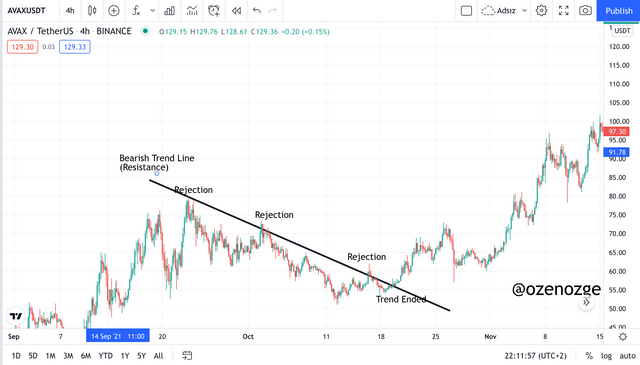
Bearish Trend Line also works as resistance. As the price rises, it tests to hit this resistance point and break the trend. So Lower-high points usually touch this trend line. If the price can break this resistance, the uptrend is likely to begin.
4) Pick up any crypto-asset chart and answer the following questions
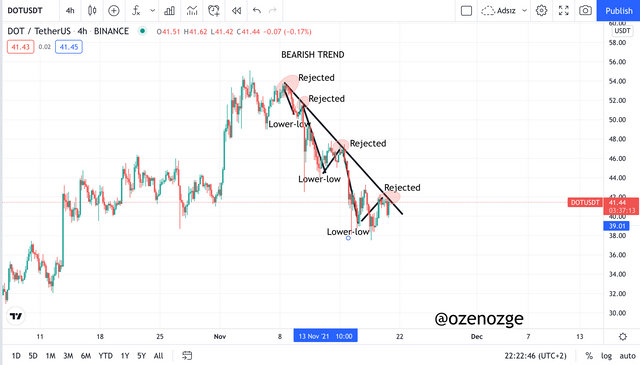
For this question, I chose the DOTUSDT pair, which is one of the projects I plan to invest in. As can be seen in the chart below, the price of this coin is currently decreasing. For this reason, there is a bearish trend, that is, it is in the trending market phase.
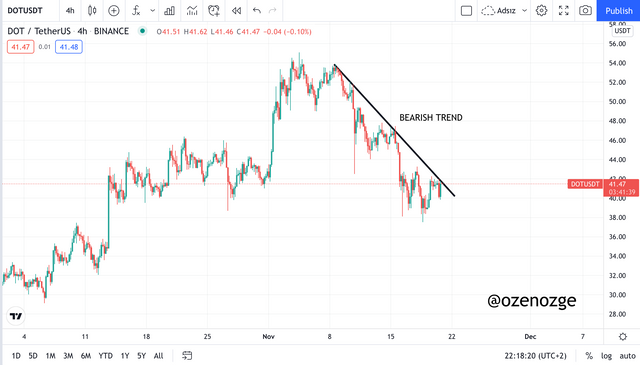
As can be seen in the chart below, DOTUSDT price continues its downward trend. Let's consider this trendline as resistance after the bearish trend is drawn. After this trend started, the price tried several times to break this resistance, but it has not been successful yet. So Bearih Trend still continues.
5) Conclusion.
Understanding trends and being able to use them effectively is a very basic feature that all traders should have. These trends are also working successfully in crypto markets. The market is basically in a trending or ranging phase. Trending is divided into two as Bearish (Downtrend) and Bullish (Uptrend). By following these trends, we can determine the points where we will enter or withdraw from the market. In addition, the probability of making a profit by following these trends is quite high. But it should be remembered that one method is never enough for successful trading. By using these trends in combination with indicators or other tools, it is quite possible that we will increase the chances of success.
Best Regards, Özge
Hello @ozenozge, I’m glad you participated in the 1st week Season 5 of the Beginner’s class at the Steemit Crypto Academy. Your grades in this task are as follows:
Observations:
Two points is ok which is drawn into the future.
Recommendation / Feedback:
I'm impressed with your submission. Thank you for participating in this homework task.