Crypto Academy / Season 3 / Week 3 - Homework Post for Professor @lenonmc21 / Trends, Trend Lines and Chart Patterns /by @ononiwujoel
Hi Professor @lenonmc21, I'm ononiwujoel one of your students in Crypto Academy and a member of the steemit platform. This is my homework submission post from your lecture Trends, Trend Lines and Chart Patterns
Introduction
As a newbie in the crypto world, it very necessary that we understand simple tools and modus operandi of the crypto market and how they function. With this knowledge we can easily make the right decision that will maximise our returns and minimise losses during trading and investment. Otherwise we may take unnecessary risks and end up making lots of avoidable mistakes and losing much funds in trading simply because we failed to learn the basic tools and general information available to traders in the crypto market and one of such information is about the trends, resistance and support in Crypto charts. This is the subject of interest in this lecture.

Define in your own words what is a "Trend" and trend lines and what is their role in charts?
What is a Trend?
A trend can be described as a general line of orientation or a general direction of flow. In other words, it the prevailing or more accepted direction of movement.
In charts, a trend is the general direction of movement in prices of assets, whether upwards or downwards with respect to the interests of traders and investors in the market. A trend happens when majority of investors and traders are collectively moving the price of assets to either rise or fall.
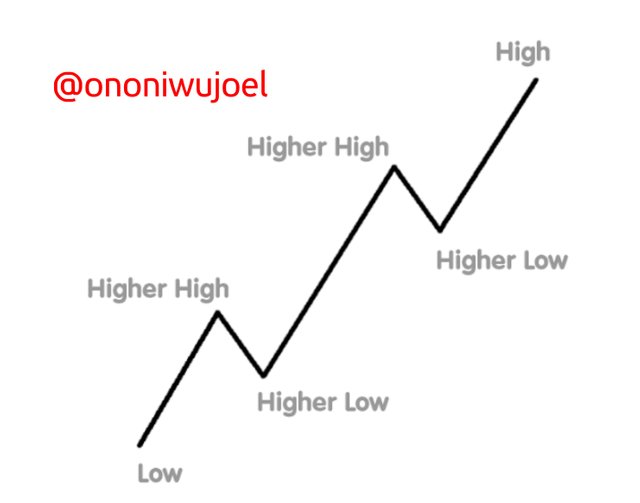
A movement upwards is called an uptrend or a bullish trend while a movement downwards is called a Bearish trend. The bullish trend happens when each of point of support in the chart is higher than the previous one and the Bearish trend happens when each point of resistance in the chart is lower than the previous one.
What is a Trend Line?
A trend line is line drawn on the chart to connect the swing highs (resistance points from where a downward movement Starts) or the swing lows(support point from where an upwards movement starts) so as to get the actual direction of price movement.
There is also a sideways trend line and this trend line shows that there is no bullish or Bearish at the time and so the prices are at a stable movement rate. This also shows that the proportion of buys and sells are roughly equal.
The Trend Line is a very useful tool used in keeping track of the direction of price movement by traders and investors to help them make the right decisions when investing or trading so as to make the most out the trends in asset prices.
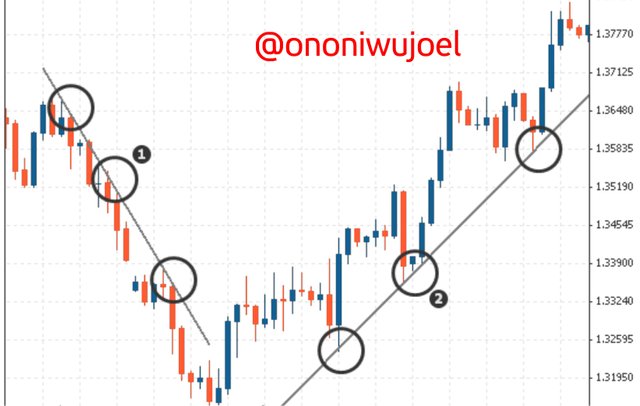
In the image above, the line labelled 1 is a downtrend while the other line labelled 2 is an uptrend line.
Roles of Trend and Trend Lines in Charts
Trends in chart is a very basic information to investors and traders before venturing into an asset because it shows the direction of general interest of traders in the market and of course this is what determines the price of the asset and its price movement too.
Trends are also important in technical analysis, the bullish trends and bearish trends are one the vital information available on the charts, and this is what is used to forecast prices as well as have knowledge on the level of risks in investing in the asset.
Trend Lines on the other hand is a tool used in technical analysis to ascertain the direction of price movement of an asset in the charts to know when to trade and the probability of returns.
Trend Lines also show when there is a bullish trend or a bearish trend or No trend and at such help in making decision making during trading
Trend Lines also help traders to forecast price movement of an asset
Explain how to draw an uptrend line and a downtrend line (Show a screenshot of each).
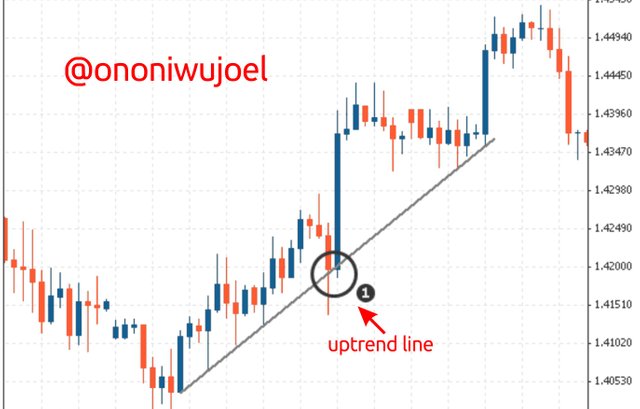
Uptrend Line
An uptrend line is drawn by connecting the swing lows or ascending minimum points or ascending support points with a single line.
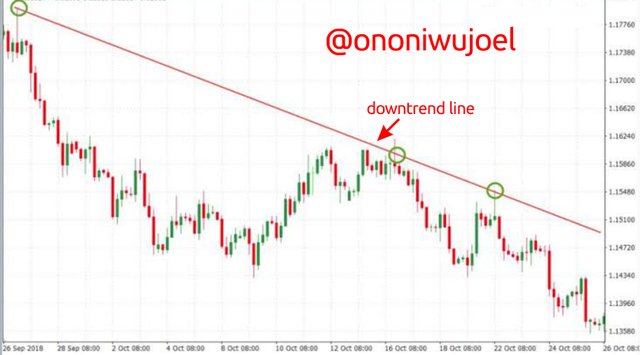
Downtrend Line
A Downtrend line is drawn by connecting the swing lows or descending maximum points or descending resistance points with a single line

Define in your own words what "Supports and Resistances are and how we can identify both zones (Show a screenshot of each one).
Support and Resistance
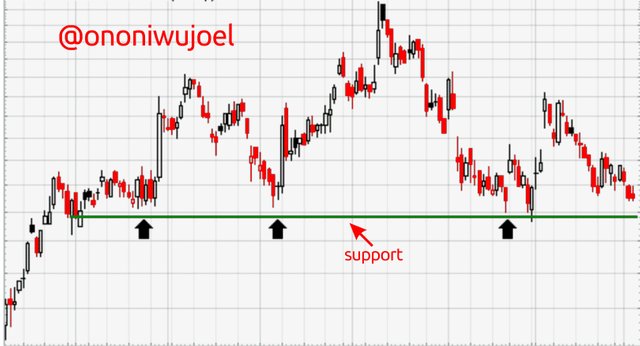
A support can simply be defined as an area or point range where the price movement is likely to stop decreasing and start increasing during a downtrend.
A resistance on the other hand is a direct opposite of a support. It is an area or point range where the price movement is likely to stop increasing and start descending during an uptrend.
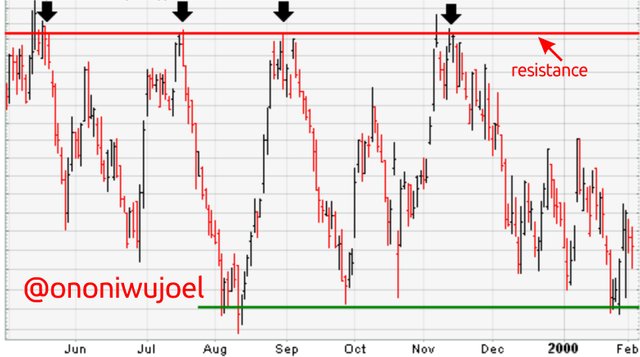
In every chart there are supports and resistances, and this helps traders minimise risks and maximise profits by knowing when prices are likely to start ascending and descending. This is a primary tool in Charts and is very useful in reading charts and predicting the direction of price movement in a chart.
How to identify zones of support and resistance
Identifying a zone or an area as support or resistance largely depend on how many times there have been a swing in direction of price movement at that point. If there have a break and then opposite direction of price movement at a particular area in a chart more than twice then there is likely to be a repetition of that whenever the price gets to that same area and the more it happens, the more that area becomes relevant as a support or a resistance.
For example, if you observe the charts above you can see that there is a change of movement more than once at the marked area, this shows that that area is a resistance to further bearish trend in prices. The more this happens the more relevant that area becomes as a resistance and can be used to predict an upsurge in prices during a downtrend.
And same idea applies to a support as well.
Explain in your own words at least 2 simple chart patterns with screenshots.
Cup and Handle Pattern
This pattern is very common in stock trading, it is a bullish trend that hits a resistance and then start a bearish trend which continues with no trend for a while after reaching a support area, then it resumes its uptrend and this time it goes higher than the previous bullish trend thereby forming the shape of a cup and Handle.
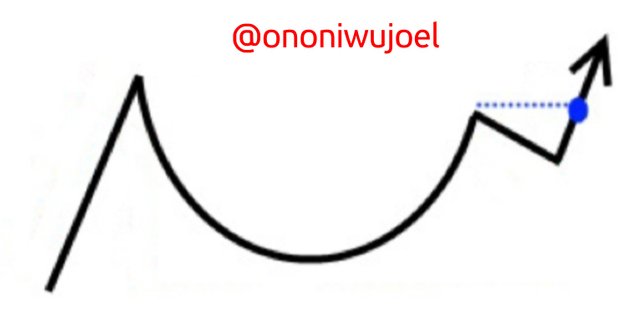
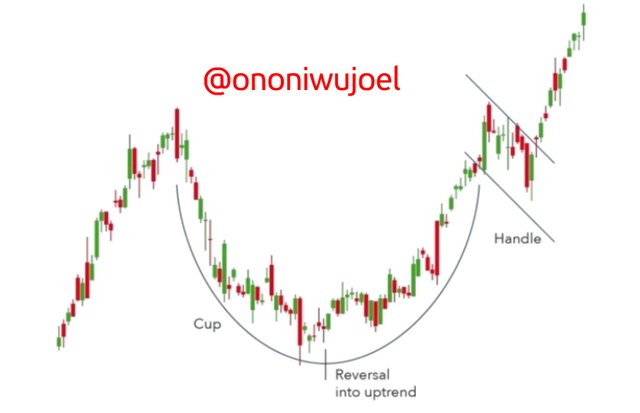
This trend is easy to understand and also reliable to some extent. You can invest during the long No trend between the Bearish trend and the next bullish trend and that way be sure of making good profits.
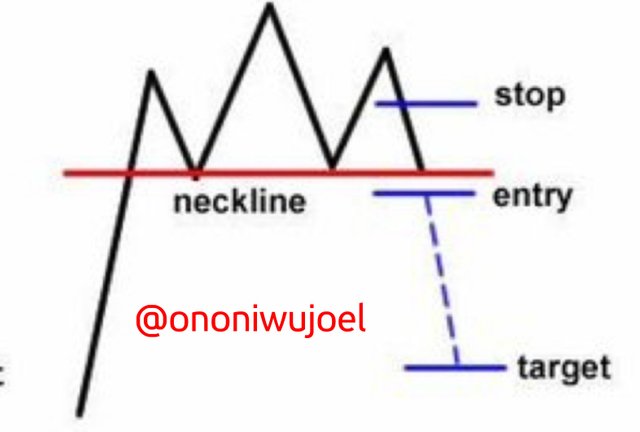
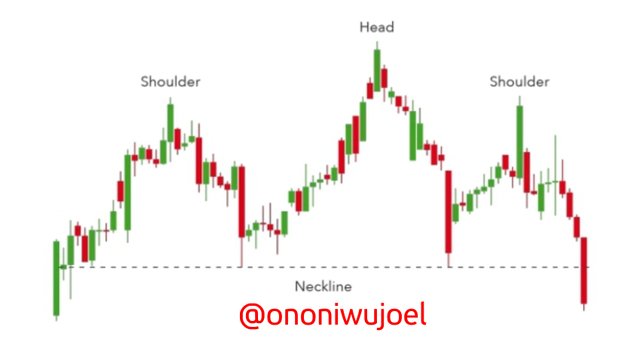
Head and Shoulders Pattern
This pattern is also very common in Charts and also very reliable for trading. It is a chart pattern where an uptrend just failed, in other words it is when there is an uptrend but then after a brief second downward movement the next high is lower than the previous high, which shows that the bullish trend is already exhausted and there will likely be a bearish trend.
Conclusion
Trends remain a basic concept in trading and the crypto market and every trader is required to have a good knowledge of trends and how use it to minimise risk in trading and also to make the right decisions on investment especially in cryptocurrency.
Resistance and Support are also very important tools for technical analysis in trading and helps in decision making, monitoring price movement and also forecasting. So these are all important and basic knowledge for all traders.
It was a great lecture and I really learnt a lot.
Cc: Professor @lenonmc21
Thank you so much for your post dude! Monitoring price indeed very important to decide you should buy or sell.