Steemit Crypto Academy Season 3 Week 4 - Beginner's Course | Candlestick Patterns for @reminiscence01 by @olawole111
Good day everyone,its a bright now day a cool week in the steemit crypto academy, with a very good lecture on candlestick pattern from professor @reminiscence, you've done a wonderful job impacting knowledge in us as a student of the steemit crypto academy and am happy to be part of your class.
Today I will writing a report/assignment on candlestick pattern having gone through series of lectures.
In your own words, explain the psychology behind the formation of the following candlestick patterns.
- Bullish engulfing Candlestick pattern
- Doji Candlestick Pattern
- The Hammer candlestick pattern
- The morning and evening Star candlestick pattern.
Bullish engulfing Candlestick pattern
Bullish engulfing candlestick pattern is one of my best candle stick pattern and is a very essential candlestick pattern which is either bullish or bearish reversal, it can be located anywhere in the chart but the most important place or region a trader should look out for is when it is found at the top of a uptrend or when it is found below a downtrend, its indicating a reversal or continuation.
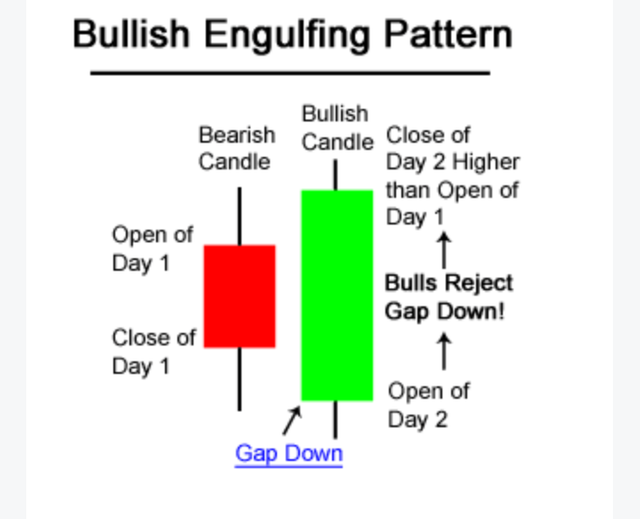
The bullish engulfing candlestick is made up of two candles depending on where it is formed, it is made of a small body bearish candle and a big bullish candle if it is moving upward and in the case of a downtrend it will for a small body bullish candle and a big body bearish candle.
When this is formed the bugger candle covers all the small candle both the body and the wick. Having seen this in a chart it shows us that we have an engulfing candlestick pattern
Doji Candlestick Pattern
A doji candlestick pattern is a candle stick pattern with a long with and a small body, its also an important candlestick pattern in making decision In the market.
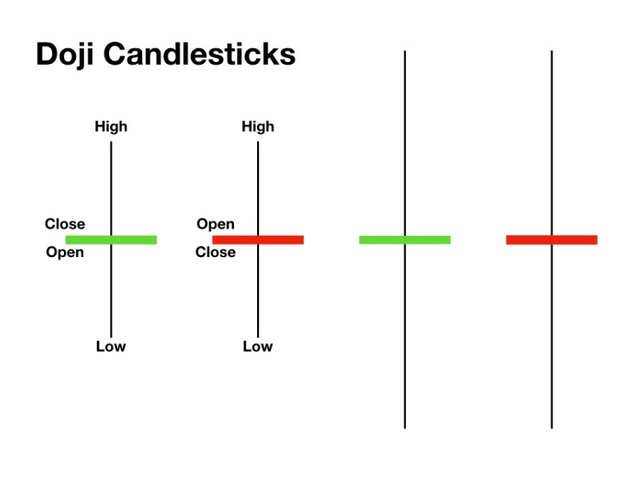
When a doji appear in a chart it signifies indecision meaning the buyers and the seller are in a great Battle that why we see it is always with a long wick the buyers are dragging and the Sellers also dragging the market, when any trader finds this type of candle, the trader most be patient enough to Wait for a confirmation candle pattern before taking any trade.so as not to fall into fake out.
The Hammer candlestick pattern
Hammer is a very good candle to spot in a chart and its a very strong reversal candle when spotted on top or below a trend, its divided into two; we have the Hammer and inverted hammer
HAMMER
Hammer is a candle with a long wick below the head of the hammer and the hammer head consist of a small small body at the top of the candle, this indicate that buyers are taking charge of the market. Hammer is formed below a down downtrend showing a trader that there's about to be a reversal.
.jpeg)
INVERTED HAMMER
Inverted hammer is a candle with longer wick at the top of the candle and below it is the head which is smaller. This is a reversal candle and its found at the top of an uptrend which indicate that sellers are gaining control over the market so therefore the market is about to have a U-turn.
.png)
The morning and evening Star candlestick pattern.
The morning Star
Source
The morning star is a important reversal candle. It consist of three candles a bearish candle ,doji, and a bullish candle. When a morning star is spotted at the bottom of a downtrend this is indicating a U- turn. So a trader should be ready to close his entry and be ready to pick up another entry.
The evening star
The evening star is the opposite of morning star
Its a candle stick pattern a cryptocurrency trader should be mindful of, because its a reversal signal which implies a U-turn is about happen in the market.
.gif)
Identify these candlestick patterns listed in question one on any cryptocurrency pair chart and explain how price reacted after the formation.
Bullish engulfing pattern
Here, the bear candle covered the bullish candle
Which indicate reversal and it is clearly shown in the screenshot above
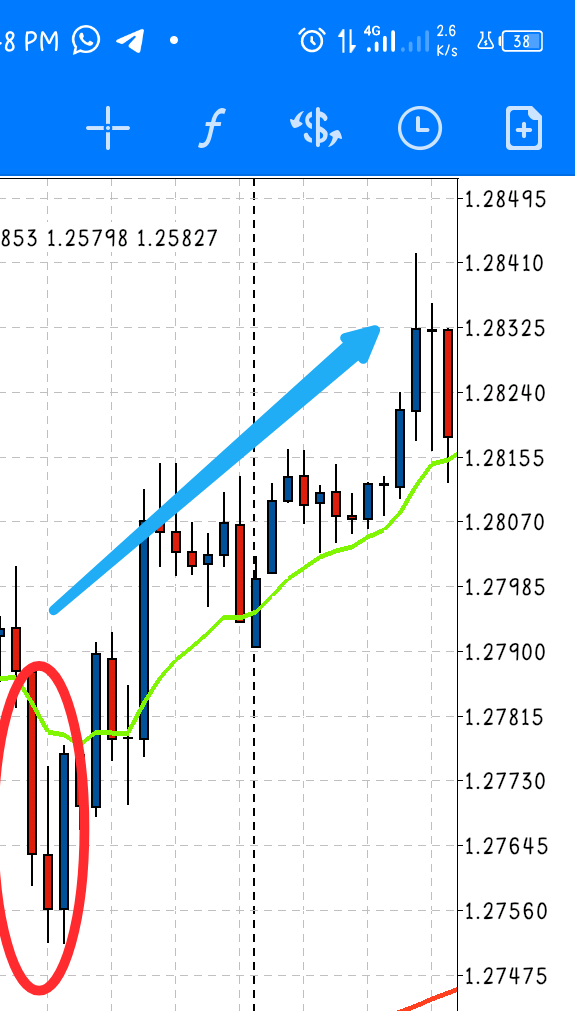
Here, the bear candle is covered with the bullish candle which makes it a complete engulfing pattern and this indicate a reversal upward.
A trader should be mindful of this candles.
Doji Candlestick Pattern chart
This a doji and it indicate indecision, when trader spot this candle, he/she should wait and be calm for confirmation candle before taking a trade.
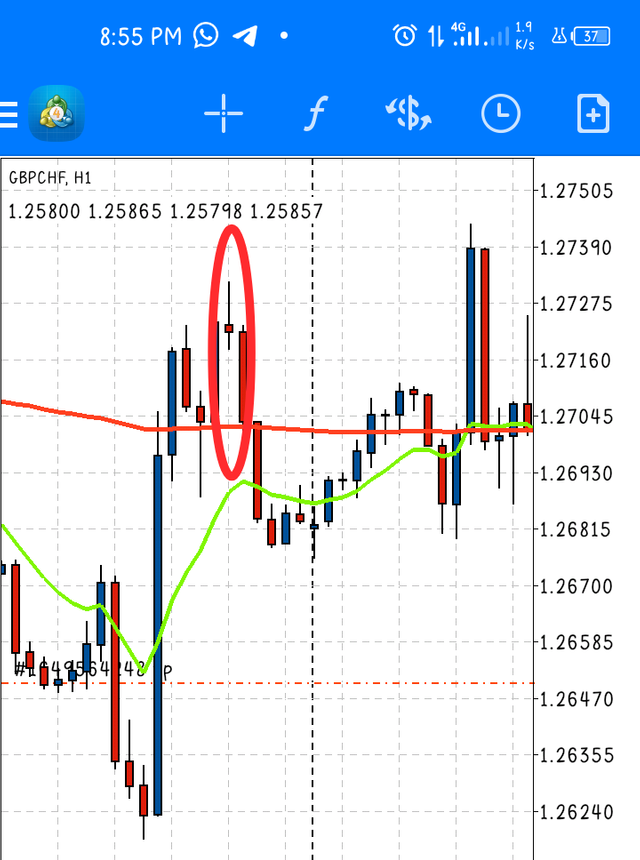
The Inverted Hammer candlestick pattern
This is a BTCUSD chart , in this chart an inverted hammer was spotted at the top of an uptrend which indicate a downward reversal as we can see in the BTCUSD chart.
Hammer candlestick pattern
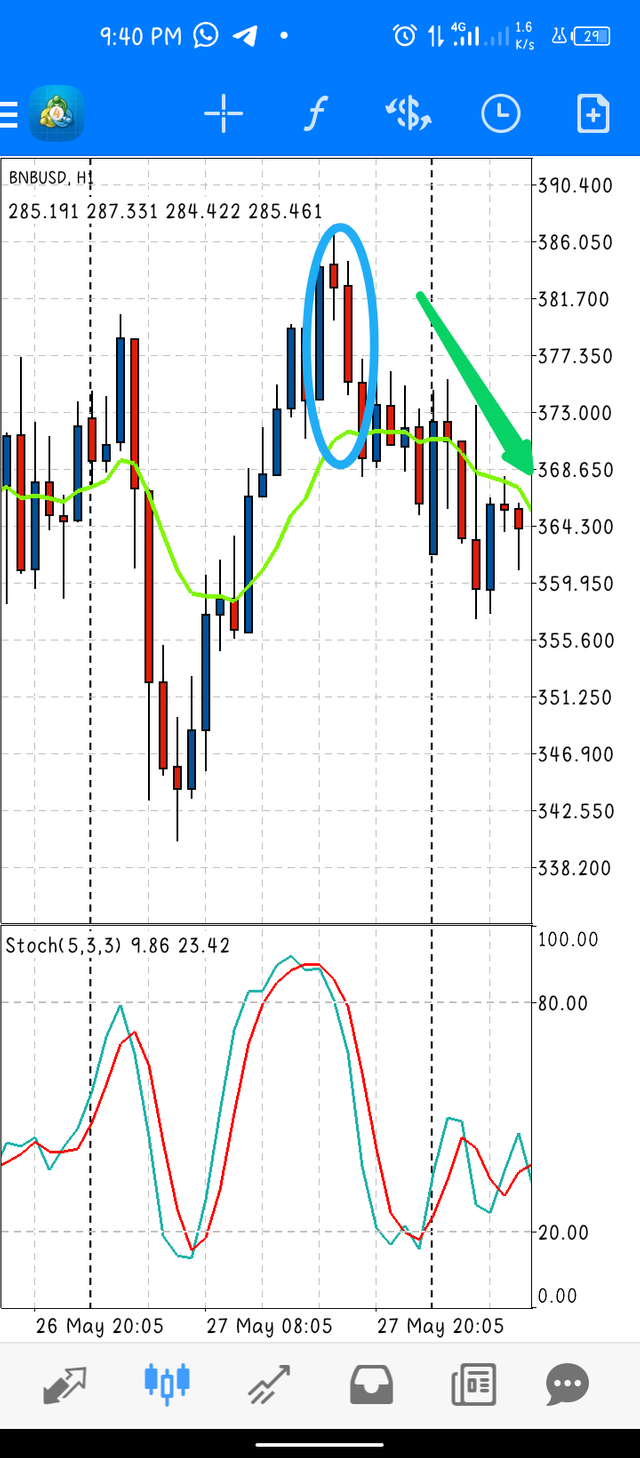
This is a one hour BNBUSD chart, here a hammer is formed which gives a signals that the market is about have a U-turn, so this indicates that trader should be prepared to BUY , we can actually see it in the above screenshot.
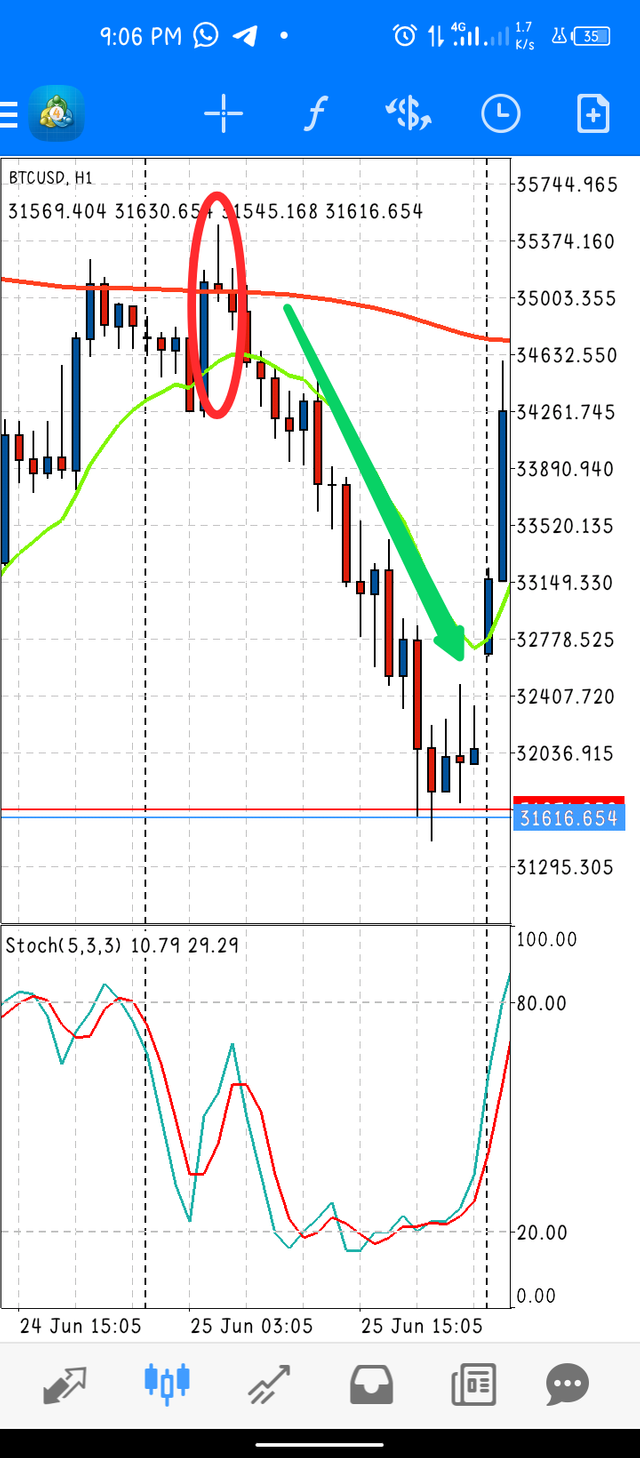
The morning and evening Star candlestick pattern.
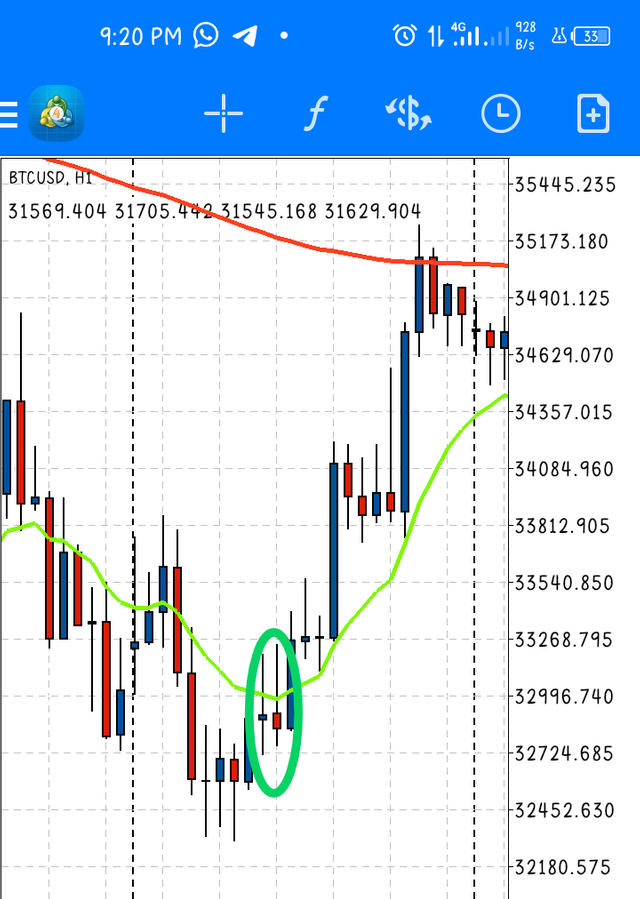
morning star pattern
This is a BTCUSD chart, here we can spot a morning star pattern, which was spotted at the top of a uptrend, this gives a reversal signal which is shown in the above screenshot.
Evening star pattern
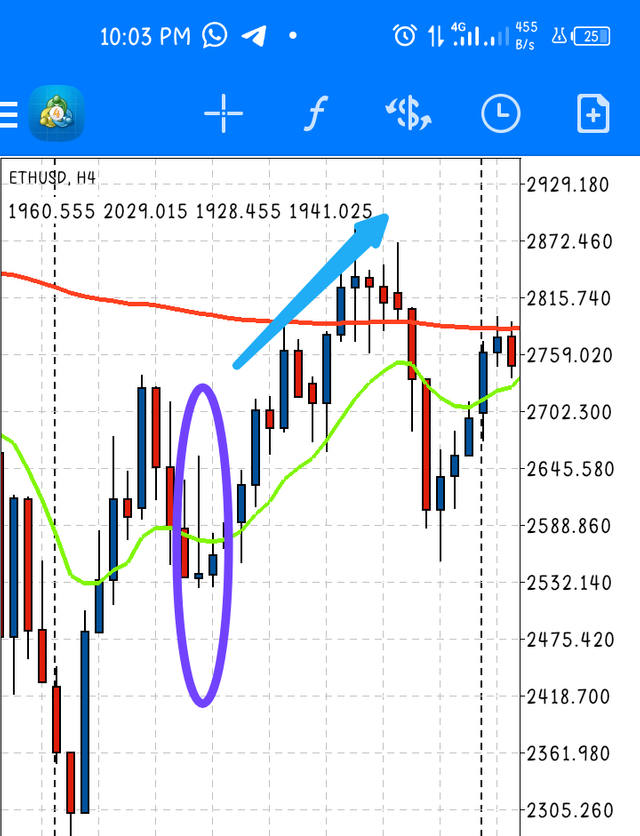
Here is an ETHUSD chart, here the first bear was formed followed by a doji candle then a long bull candle which indicate an evening Star pattern,if this is found in downtrend it indicate that price is going the other way round. As we can see in the above screenshot.
Using a demo account, open a trade using any of the Candlestick pattern on any cryptocurrency pair. You can use a lower timeframe for this exercise
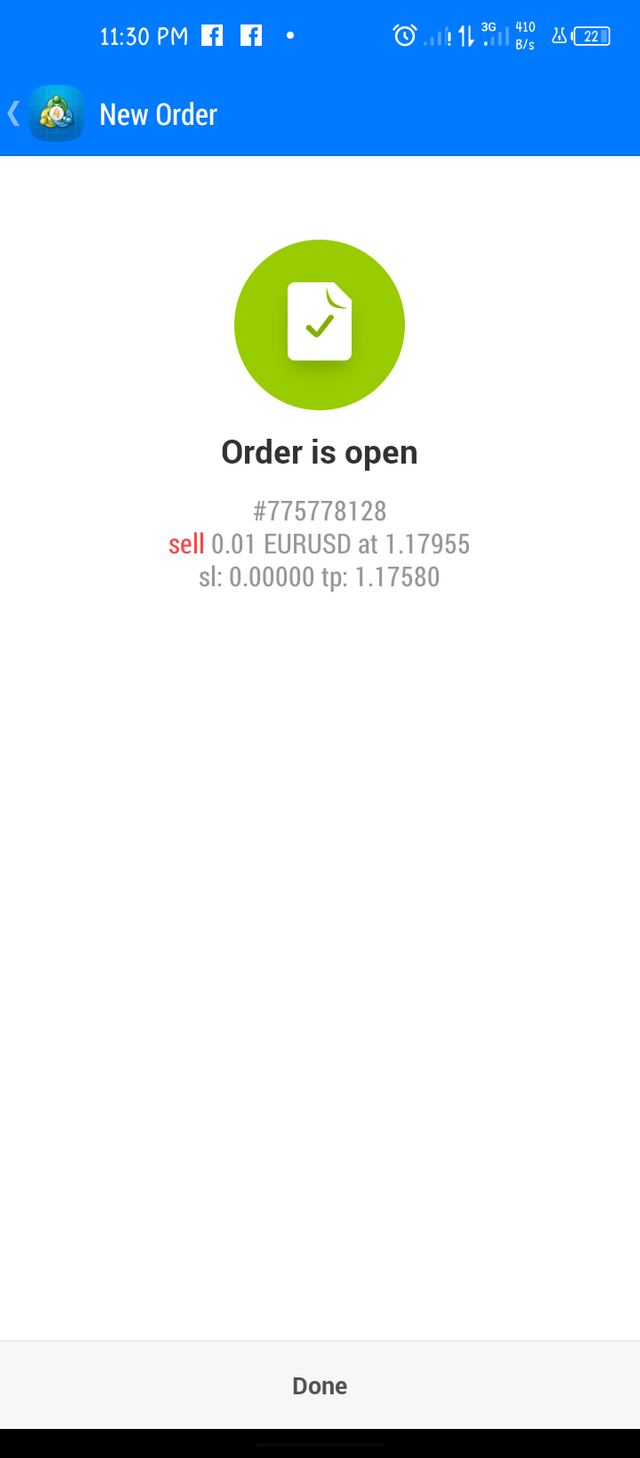
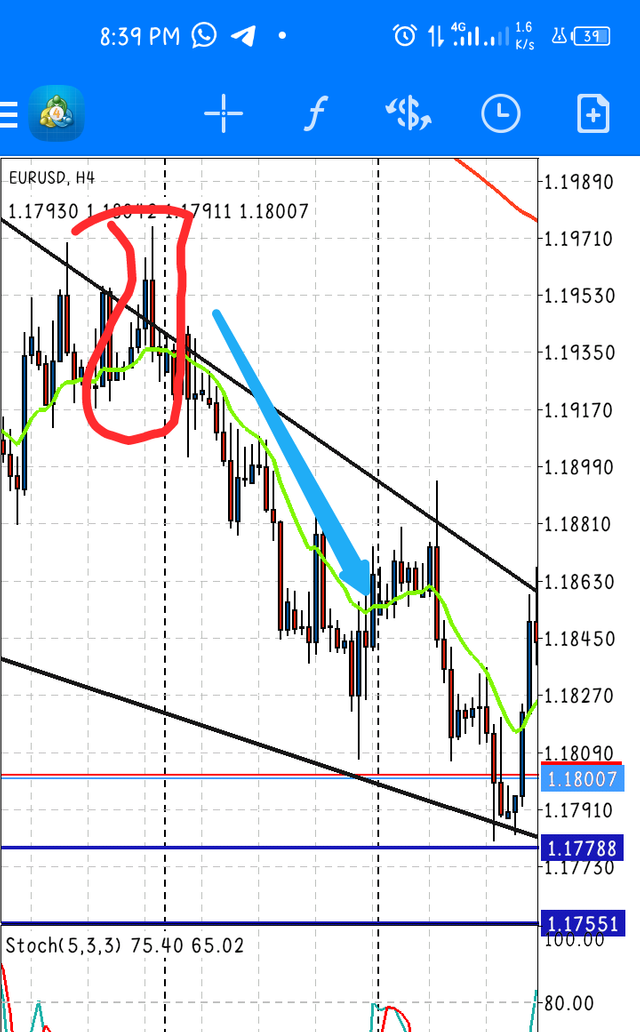
This is a eurusd trade opened on my Mt4 ,I was unable to trade cryptocurrency on demo please sir pardon me for using EURUSD, before I took this trade I did some little technical analysis but I concentrated more on candlestick pattern.
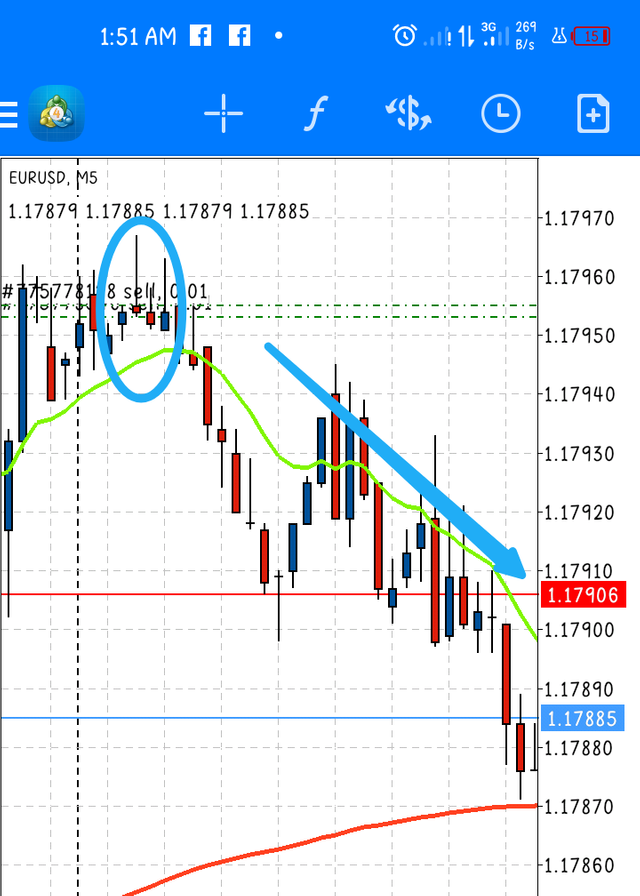
This is a 5min EURUSD chart as soon as I spot the inverted hammer shown in the screenshot according to the lecture by @reminiscence I knew a reversal is about to happen and immediately I placed a sell order and i was happy it turned to be a profit .
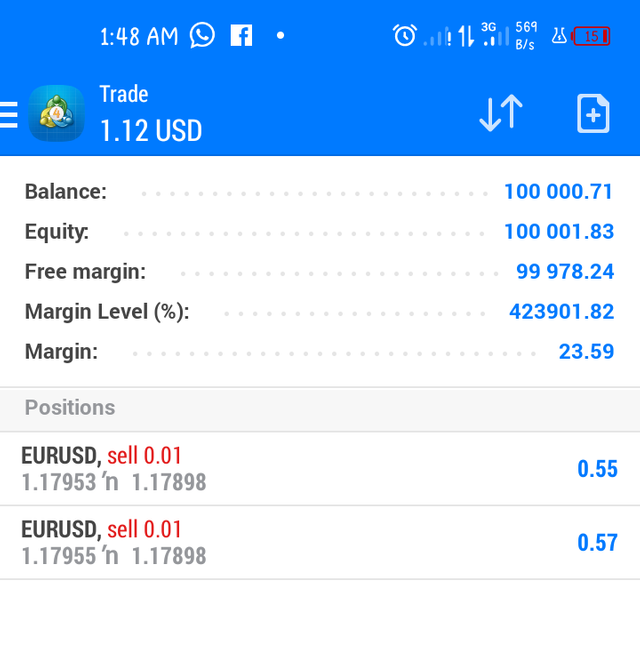
N.B : sir!! All unsourced screenshot are from my Mt4 trading platform.
CONCLUSION
Currently am so happy I partook in this class and in the assignment it has given more insights about trading with candlestick. And all traders should not something that trading candlestick pattern alone is not the best but combining it with other technical analysis to have a perfect entry thank you.