Crypto Academy | Season 3 | Week 3 - Homework Post for @lenonmc21 || Trends, Trend Lines and Chart Patterns
Define in your own words what is a "Trend" and trend lines and what is their role in charts?
An overall direction of an asset's price or market in which an asset price is developing or changing.
Trend line is a chart pattern that can be defined as a different categories of highs or lows that form a straight line. It is created by joining different price points with a straight line.
The role of a trend line is to identify the historical trend of the price movements a cryptocurrency and to identify support and resistance level. In technical analysis, it is one of the primary components of other chart patterns like trend channels, wedges, flags, and triangles. The trend line is usually extended forward to show sloped areas of support and resistance. Trend lines can be have high ( resistance ) or low ( support ).
Trend lines are used:
- To forecast degree of support and resistance.
- To know and confirm trends.

Explain how to draw an uptrend line and a downtrend line (Show a screenshot of each).
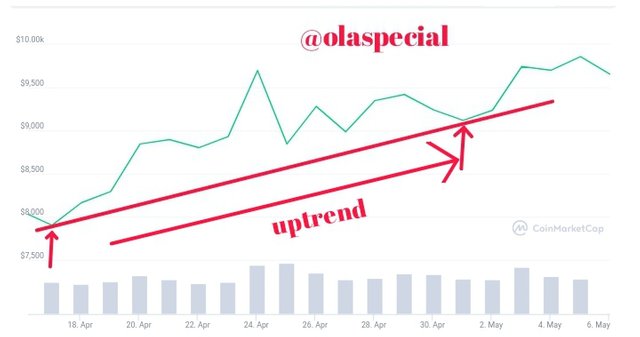
An uptrend line is created by connecting the lows, where the previous low price is higher than the recent low price. An uptrend line moves into the future and can be called the support level. So far the price degree remains above this line than we have a bullish trend. The positive slope shows that there are more buyers than sellers.
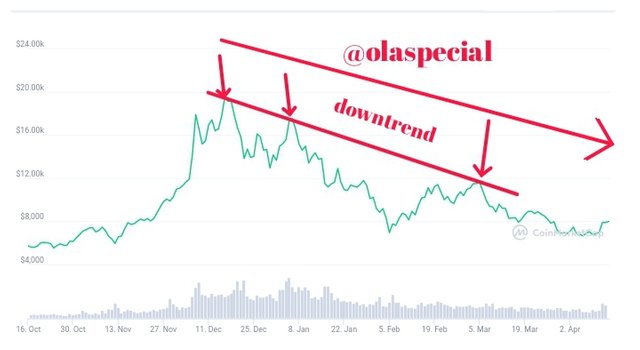
A downtrend line is the direct opposite of a downtrend line. It is created by connecting the highs, where the previous high is lower than the previous high. A downtrend line stretches into the future and can be thought of as a degree of resistance. The negative slope shows that there are more sellers than buyers.
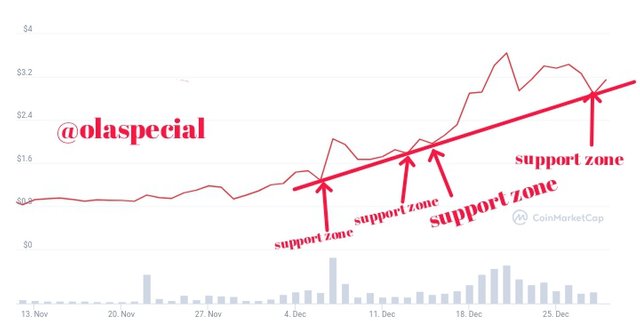
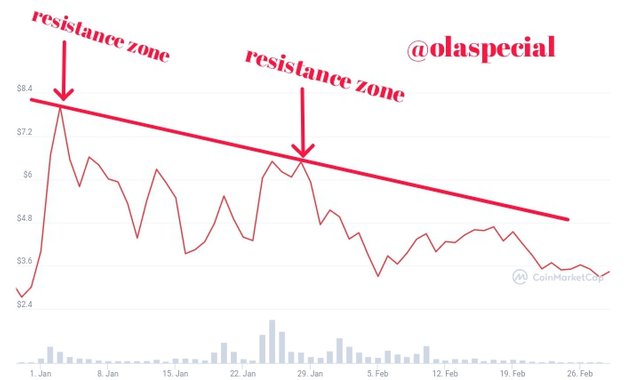
Define in your own words what "Supports and Resistances are and how we can identify both zones (Show a screenshot of each one).
Support lines show prices where the market had difficulties breaking below. This signals that the same price degree could also stand for an obstacle for the price to move lower. Usually, there is a huge number of buy orders placed just around vital support levels. When these are carried out it can cause the price to move off the support level. That is the buyer move into the market when the price reaches important support prices.
Resistance line is similar to support line, only that they represent price degrees at which the price had difficulties to break above. This signals that the same degree could also act as a resistance or obstacle, for the price to move higher. While buy orders are placed around vital support degree, sell orders are joined around important resistance levels. In other words, sellers move into the market when the price reaches a vital resistance level.
Explain in your own words at least 2 simple chart patterns with screenshots.
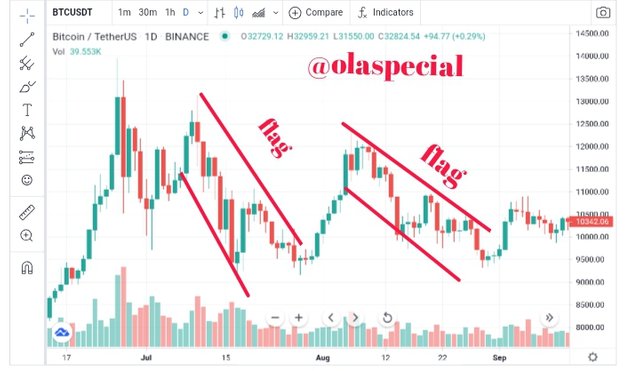
Flags are formed using two parallel trend lines that can slope up, down or horizontal. A flag that has an upward slope display as a pause in a down-trending market, a flag with a downward trend display a break in the period of an up-trending market. The construction of the flag is determined by a period of declining volume, which recovers as value breaks out of the flag formation.
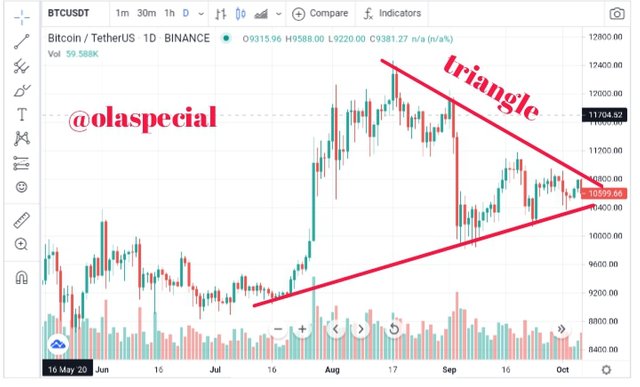
Triangles are very usual chart patterns used in technical analysis since they happen always compared to other patterns. The three usual categories of triangles are explained below.
Symmetrical triangles happen when two trend lines move toward each other and signal only that a breakout is possible to happen.
Ascending triangles are known by a flat upper trendline and an upward lower trend line and give a breakout higher is likely.
Descending triangles have a flat lower trend line and a downward upper trend line that give a breakdown have the potential to occur.
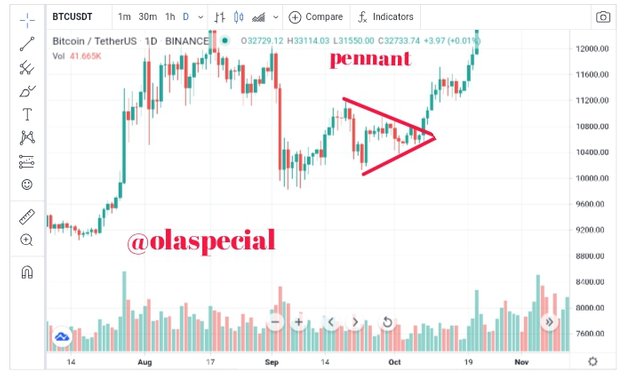
Pennants are formed with two trend lines that move. A feature of pennants is that the trend lines head toward two directions. In other words, one will be an up trendline and a down trendline.
It is essential for a beginner in the world of cryptocurrency trading to understand the concept of trends, trend lines, and chart patterns and also the concept support and resistance degree because many advanced strategies rely on the basis these concepts. A lot technical tools have been created to utilize these concepts.
Thank you @lenonmc21 for the wonderful lecture.