Understanding trends - Crypto Academy / S5W1- Homework Post for @reminiscence01


- a) What do you understand by a Trending market?
b) What is a bullish and a bearish trend? (screenshot required)
- Explain the following trend identification and give an example of each of them. (Original screenshot needed from your chart). Do this for a bullish and a bearish trend.
i) Market Structure.
ii) Trendlines
- Explain trend continuation and how to spot them using market structure and trendlines. (Screenshot needed). Do this for both bullish and bearish trends.
- Pick up any crypto-asset chart and answer the following questions -
i) Is the market trending?
ii) What is the current market trend? (Use the chart to back up your answers).
- Conclusion.
INTRODUCTION: Good day @reminiscence01 and every member of this community and welcome to my homework post for season 5 week 1. This is a very good topic and you did a very good job in making everything understandable. Thanks for imparting this rewarding knowledge.


Before I go ahead to explain what the trending market is, I will like to explain some terms. The cryptocurrency market is a type of market that exhibits a constant change in the price of assets and in which this price change generally moves in a particular direction. This movement in a particular direction is what brings about the word trend. What is a trend? A trend is said to be the general direction of the price of a market or asset and it could be an uptrend or a downtrend or ranging. As you can see, there are now three terms uptrend, downtrend, and ranging.
What do these terms mean?
Uptrends are trends that are marked by rising data points, such as higher-highs and higher-lows. An uptrend is also marked by an overall increase in price and this is due to the presence of oscillations. In science, the law of gravitation says that anything that goes up must come down this means that nothing goes up forever and this is why the word overall is essential, the overall direction needs to be higher for it to be considered an uptrend.
In another word, Uptrends connects a series of higher lows to create a support level for future price movements. The support level is simply the level that stops the price from moving downwards. i.e., it is the level where the traders expect maximum demand in terms of buying.
Downtrends are trends that are marked by falling data points, such as lower-lows and lower-highs. Downtrends connect a series of lower highs to create a resistance level for future price movements. The resistance level is a level that ceases the price from moving upwards. It is the level where traders expect maximum supply in terms of selling.
Ranging market is when there is neither an uptrend nor downtrend since prices fail to create either a new high or a new low. This phase is regarded as the accumulation phase for profit-taking or a trend build-up.
Understanding these key terms will make one understand what is meant by the trending market.
Now, to what I understand about a trending market.
A trending market is a type of market in which price is generally moving in one direction. These trends are usually depicted by higher- highs and higher-lows which make an uptrend and lower-highs and lower-lows in a downtrend just as explained above. In a trending market, Liquidity is an important term because, the more liquidity of a currency pair, the more the movement and we should know the more the movement, the more the chances of the price moving strongly in a direction.
Traders should be able to identify trends to make maximum profits and avoid trading against the market direction. Also, just as learned from the lecture, the trend is one’s friend if only one understands how to identify trending markets.
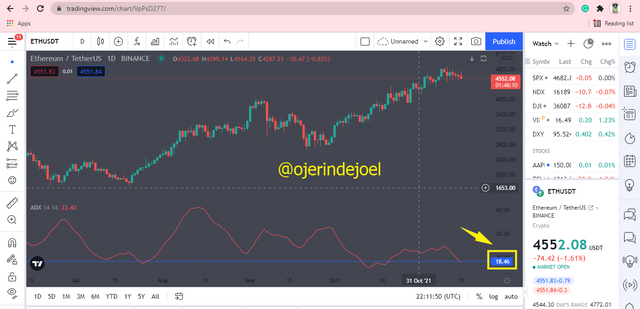
Apart from the two methods (Market structure and Trendlines) which I am going to talk about later as I proceed, another way of identifying trending market is with the use of technical indicators like Average Directional Index indicator (ADX), Moving averages, Bollinger bands, etc. all this we can access on Tradingview but let me make use of ADX to identify the trend exhibited by ETH/USDT pair just to back up all I have been saying.
The ADX was developed by J. Welles Wilder and this indicator makes use of values ranging from 0-100 in determining if the price is moving strongly in one direction, i.e., if it is trending, or ranging and we should know, the higher the number is, the stronger the trend.
Below is the screenshot of the ETH/USDT pair with the ADX indicator. just as was earlier said the higher the number is, the stronger the trend and with this, we can say the market trend for this pair is not strong since the value is just 18.
Just as we have learned in the previous seasons, it is not advisable to make use of just an indicator in carrying out trade, it is better when combined with some other tool.
Having removed the suffixes -ish from the two keywords, we have the word bull and bear which are names of animals, and what do these animals have in opposition? Bulls are the kind of animals that attack by raising things with their horn while Bears does the opposite. When we say something is bearish, it means that things exhibit the characteristics of a bear and this is so for bullish too.
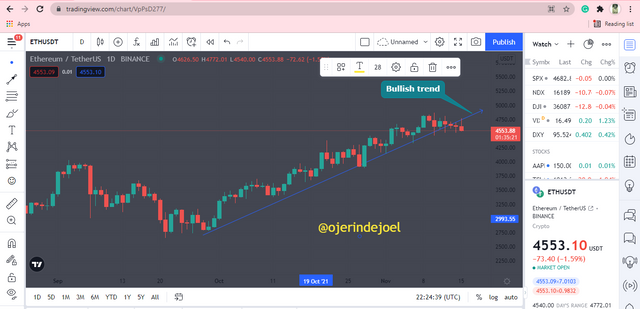
- Bullish trend: A bullish trend is also known as an upward trend on simply uptrend and just from the explanation given above, bullish trends are trends that are marked by rising data points, such as higher swing highs and higher swing lows. It is a situation in the marketplace when the price of a currency pair is headed upward and when the demand for the asset in the market increases. The majority of traders target to buy just to ensure profit-making and since the price generally moves up, the risk involved is low to the asset holder.
Below is the screenshot of a bullish trend
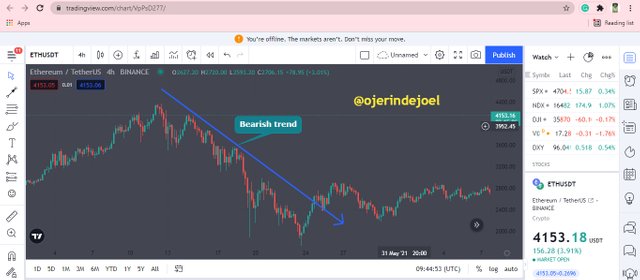
- Bearish trend: A bearish trend is also known as a downward trend or simply a downtrend. The bearish trends are trends that are marked by falling data points, such as lower swing lows and lower swing highs. It is a situation in the marketplace when the price of a currency pair is headed downside. Many traders also target to sell just to ensure profit-making in this situation and since the price is decreasing, it involves high risk for the asset holder.
Below is the screenshot for a bearish trend
Just as learned in the lecture, the market structure is one of the ways of identifying how a market is trending. It helps one to know if the market is undergoing an uptrend, downtrend, or ranging phase, and this is done with the use of candlestick patterns that are formed on the chart.
Bullish Trend
The formation of higher-high and higher low by the candlestick depicts a bullish trend. Don’t forget bullish trends are trends that are marked by higher highs and higher lows. This kind of pattern is formed because of two reasons which are;
- The current price doesn’t trade below the previous low point.
- The current price closes above the previous high point.
The bullish trend is a result of high demand from buyers and this will consequently make the price goes higher.
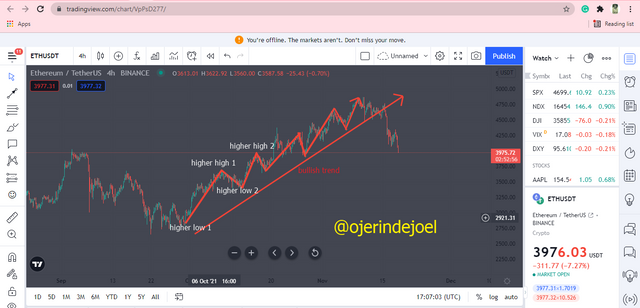
From the screenshot above we can see the higher high 2 which is above the higher high 1 and this indicates that the current price doesn't trade below the last high price. We can see that there is an increase in the market price and the increase brings about selling opportunities to the traders so also does the price decrease (retracements) brings about buying opportunity.
Bearish Trend
The formation of lower-highs and lower-lows by the candlestick depicts a bearish trend. Just as we know that bearish trends are trends that are marked by lower-highs and lower-lows. This kind of pattern is formed because of two reasons which are;
- The current price trades below the previous low point.
- The current price doesn’t close above the previous high point.
The bearish trend is a result of low demand, which results from more sellers and fewer buyers and this will consequently bring about a reduction in the price.
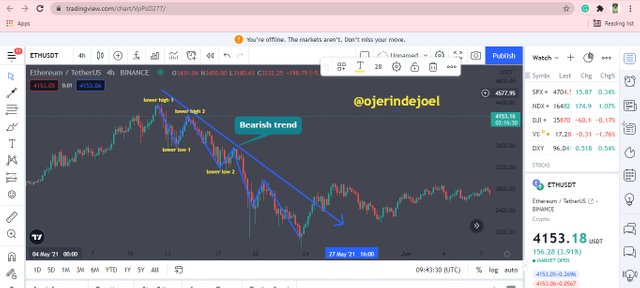
From the screenshot above we can see the lower high 2 which is below the lower high 1 and this indicates that the current price trades below the last high price. We can see that there is a gradual decrease in the market price and the increase brings about buying opportunities to the traders so also does the price decrease (retracements) brings about selling opportunity.
Another way of identifying trends is with the use of trendlines.
A trendline is an upward or downward line on a chart that indicates the movements of prices of an asset. It is a common way of identifying trends and it is a line that connects a series of highs for a downtrend and a series of lows for an uptrend. These trendlines show the overall direction of the trend and they should be redrawn for every change so as for it to reflect the new price action.
Traders should understand that when there is a break of the trendline, it might mean that the current market trend will not continue.
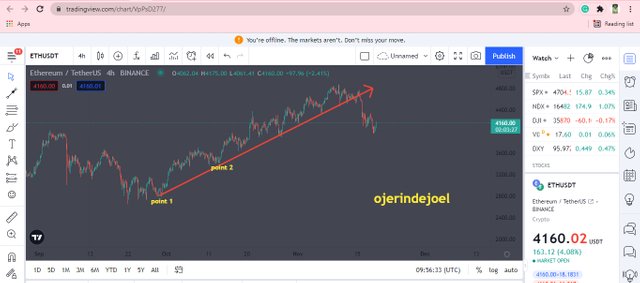
Bullish trend
The bullish trendline connects two or more low points. It acts as a support and tells us that there is more demand than supply, even as the price rises. The more and more the price touches or bounces off the uptrend line, the more valid it is. When there is a break below the uptrend line, it means that the net demand has weakened and the trend will soon change. Just as shown in the screenshot below, for a bullish trend, the trendline is drawn below the price.
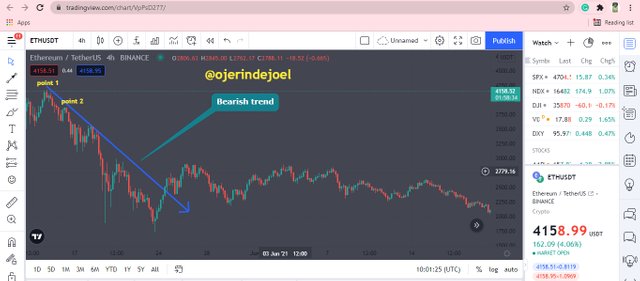
Bearish trend
The bearish trend connects two or more high points and it acts as resistance and tells us that there is more supply than demand, even as the price falls. For a bearish trend, the trendline is drawn above the price and just as it can be seen in the screenshot below, the prices continue to trade below the trendline. The more and more the price touches or bounces off the downtrend line, the more valid it is and a break above the downtrend line means that a change in trend is imminent.
Trend continuations are depicted by continuation patterns. These continuation patterns are described as retracements and fluctuations that bring about a temporary halt in the current trend but that after this small stop, the trend will continue. Trend continuation is a situation where the price continues to move in the current or let me say original trend.
In the trending market, traders should understand that prices cannot just continue to move in a completely straight line, there will be fluctuation or retracement which doesn’t necessarily depict reversal but might as well depict continuation and likewise, traders should understand that the continuation pattern can also result in a trend reversal just as it can result in trend continuation. Trend reversal is a situation where the price moves against or opposite the direction of the current or original trend.
Also, these retracements and fluctuation grant traders the opportunity to buy an asset at a lower price before the trend continues for a bullish trend and to sell an asset at a higher price before the trend continues for a bearish trend.
Market structure is the simplest form of price movement and is depicted by swigs highs and swings which are the higher high and higher lows for a bullish trend and lower high and lower lows for a bearish trend. Understanding how to read the market structure will help one to be able to identify trend continuation.
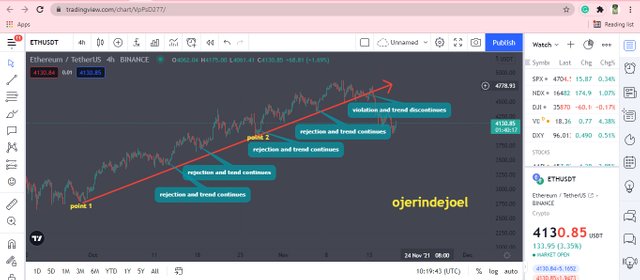
Bullish trend
For a bullish trend, higher highs and higher lows are created by the price which is also characterized by retracements. Here, this retracement creates a new low point that is lower than the previous high point and whenever this happens, it means the buyers are still in control of the price as the seller cannot make the price moves below the previous low.
For the bullish trend to continue, the following must be satisfied
- The new high point during retracement must be higher than the previous high point.
- The new low point must not be lower than the previous low point just as depicted in the screenshot below.
And likewise, If any of these two points is not validated, then there might be a trend reversal (bearish trend) as the violation tells us that the trend is weak.
From the screenshot above we can see that the trend discontinues when the new high point is below the previous high point.
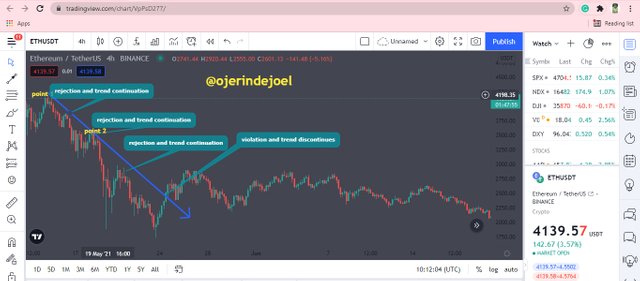
Bearish trend
For a bearish trend, lower highs and lower lows are created by the price but after a momentarily move, there is what we called retracements and this type of trend, this retracement creates a new high point which is lower than the previous high point and when this happens, it means the sellers are still in control of the price as the buyers cannot make the price moves above the previous high.
For a bearish trend to continue, the following point must be met
- The new high point during retracement must not get or be on the same level as the previous low point.
- The new low point must be lower than the previous low point just as shown in the image below.
If any of these two points is not validated, then there might be a trend reversal (bullish trend) as the violation tells us that the trend is weak.
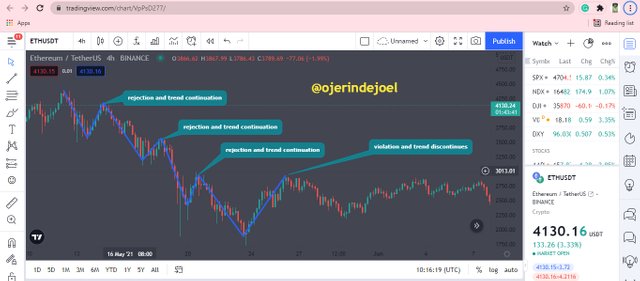
From the screenshot above we can see that the trend discontinues when the new high point is above the previous high point.
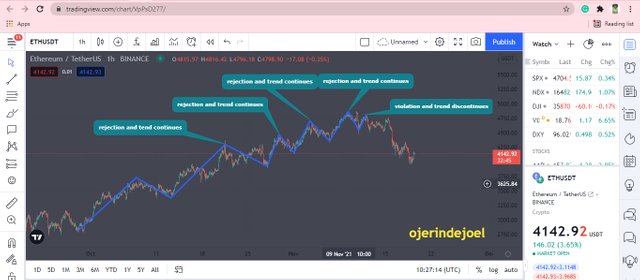
Just as explained, A trendline is an upward or downward line on a chart that indicates the movements of prices of an asset. it is a line that connects a series of highs for a downtrend and a series of lows for an uptrend and this is a common way of identifying trends. During a trending market, the price retraces back to the trendline and then gets rejected or bounces off before continuing the original trend.
Bullish trend
Just as explained the trend continues if the two criteria listed in question 2 above are met. The trend continues since the prices bounce back on hitting the trend line to continue the bullish trend and we could see that there was a change in the direction of the trend when there was a break of the trendline just as shown in the screenshot below.
Bearish trend
Likewise, for a bearish trend, the trend also continues if the two criteria listed in question 2 above are met. The trend continues since the prices bounce back on hitting the trend line to continue the bearish trend and we could also see that there was a change in the direction of the trend when there was a break of the trendline just as shown in the screenshot below.
i) Is the market trending?
ii) What is the current market trend? (Use the chart to back up your answers).
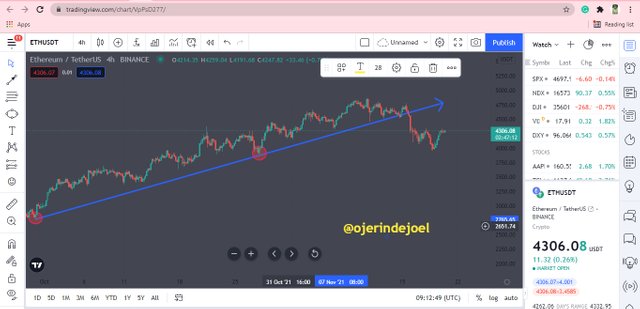
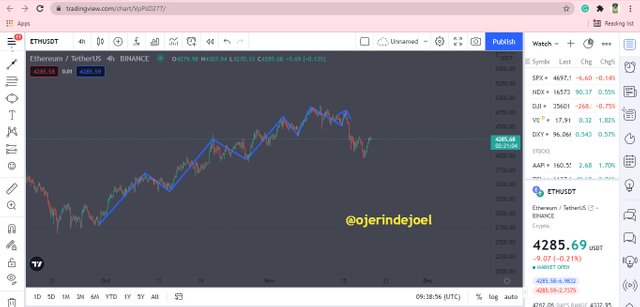
From the 4-hour ETH/USDT chart shown above, we can see that the market has been undergoing an uptrend from September 29 to November 10 when it closes at a price of $4864, The market structure shows price making higher highs and higher lows throughout this period.
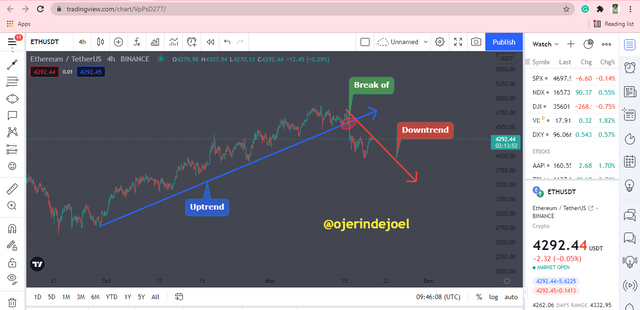
In terms of market structure, as shown above, we could see that after the retracement, the price fails to create a new higher high which must close above the previous higher high, and just as we have learned this means the uptrend does not continue. Also, in terms of the trendline, as shown below, as of November 15, we can see that there is a break of of the trend line and in this case, this depicts market reversal as the prices continue to trade below the trend line. The market stops undergoing the bullish trend and starts undergoing a bearish trend.
In summary,
- The market is a trending market as the price is moving in a general direction.
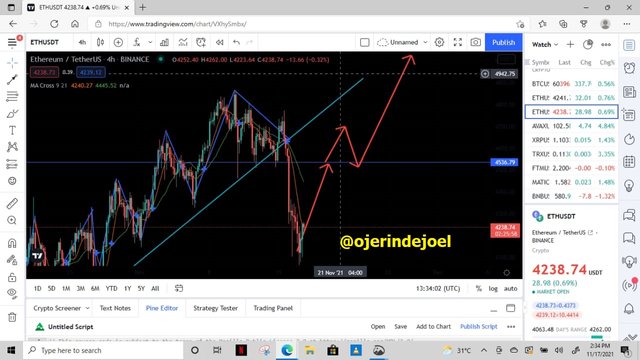
- The market is currently undergoing a bearish trend though I see it as a big retracement for the continuation of the bullish trend as depicted below
CONCLUSION
Truly, the trend is your friend if and only if you can identify and understand what it is. The trend represents the general price action. it depicts who is in control of the market, the buyer for an uptrend or the seller which is depicted by a downtrend or a ranging market where it is neither the buyer nor seller.
Traders that could not be able to identify the market will have themselves to blame because trading against the market trend could bring about a huge loss therefore as a trader it is important to have this skill thanks for this rewarding skill once again @reminiscence01.
Hello @ojerindejoel , I’m glad you participated in the 1st week Season 5 of the Beginner’s class at the Steemit Crypto Academy. Your grades in this task are as follows:
Observations:
Higher lows and higher highs. The higher high formation is an indication that price is strongly in an uptrend.
Recommendation / Feedback:
I commend your writing skills. Thank you for participating in this homework task.
Thanks for the review.
I have powered up 150 Steem in the last 30days
My #club5050 status
@steemcurator02
@steemcurator02 @sapwood @steemcurator01 @reminiscence01 @lenonmc21.
It's been 6days and my two week 1 homework posts t has not been voted, what could be wrong?
Below are the link to the post
Understanding trends - Crypto Academy / S5W1- Homework Post for @reminiscence01
Strategy and use of Donchian Channels - Crypto Academy / S5W1 - Homework post for @ lenonmc21
@steemcurator02 @steemcurator01
Why do I have less vote despite scoring 9.8/10. This doesn't go with the new guidelines (grade score multiplies by 1.5 for beginners level). I will like to know if I didn't do something right.