Technical Indicators | Steemit Crypto Academy | S4W2- Homework Post for @reminiscence01".
🔮Technical Indicators 🔮
1️⃣ a) In your own words, explain Technical indicators and why it is a good technical analysis tool.
It would be beneficial for traders trading in the crypto market to be able to anticipate the price fluctuations of cryptocurrencies as a prelude. As a tactic, traders use mathematical calculations presented graphically. Those calculations are related to the price fluctuations that have taken place in an asset over the past period. Signals based on these mathematical patterns are called technical indicators.
Used as a technical indicators tool for forecasting market prices, volumes and trends.
I think these technical indicators are a good technical analysis tool because they are designed using a series of price indices that include the opening price and closing price of an asset, so using it can make a future analysis related to that asset. Technical indicators can be used as a good precautionary measure to make a profit.
Also if a trader intends to invest in cryptocurrencies in the market, it is advisable to look at past calculations related to the assets he intends to invest in before making that investment. Technical indicators can be used as a tool to analyze it.
b) Are technical indicators good for cryptocurrency analysis? Explain your answer.
As I mentioned above the use of technical indicators is suitable for analysis related to cryptocurrencies. This is how it matters. A trader can predict the ups and downs of an asset by analyzing past information about the assets before trading. He or she can then determine if he or she is making a profit or a loss by doing that trade. As we all know the prices of cryptocurrencies are almost always volatile. So in such cases even the biggest loss that can occur with the use of technical indicators can be avoided. So I think technical analysis is a good tool.
But I have heard that some people make huge losses when trading. The success rate can be increased by analyzing the indicators before entering the trade and gaining a better understanding of them. This is because technical indicators provide the initial signals related to an asset.
c) Illustrate how to add indicators on the chart and also how to configure them. (Screenshot needed).
To answer this question I have visited the website www.trading.com and all these screenshots are taken from it.
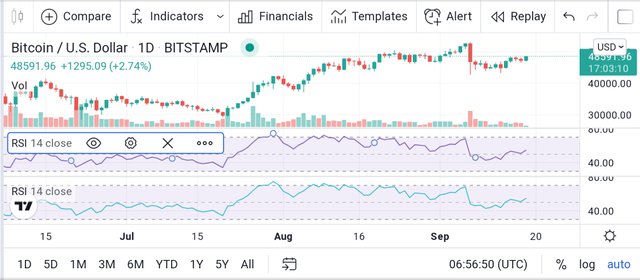
First go to trading.com and select a trading pair. I chose the BTC / USD graph chart for this. It is as in the screenshot below.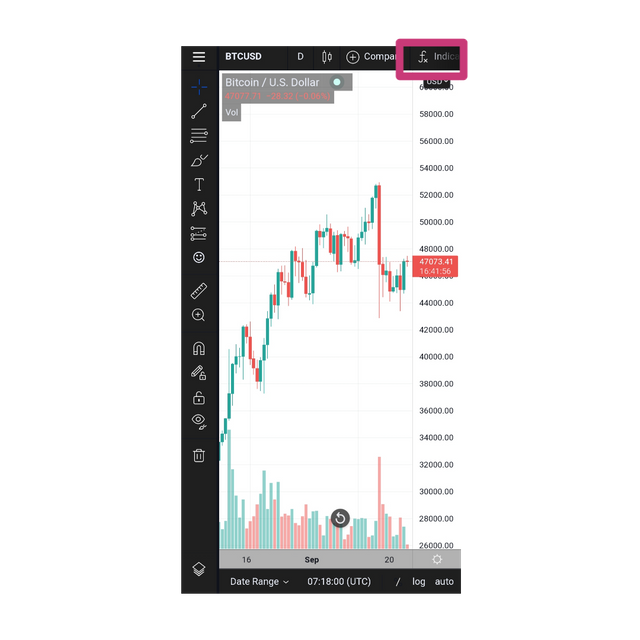
Then you can select an indicator of your choice by clicking on the indicators marked in red in the screenshot above.
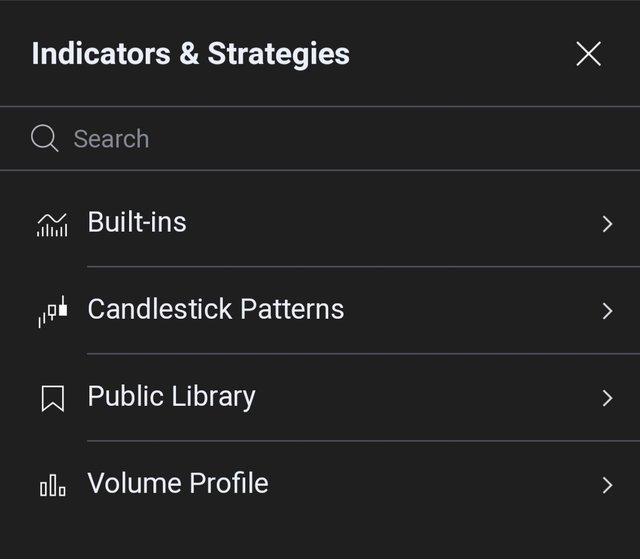
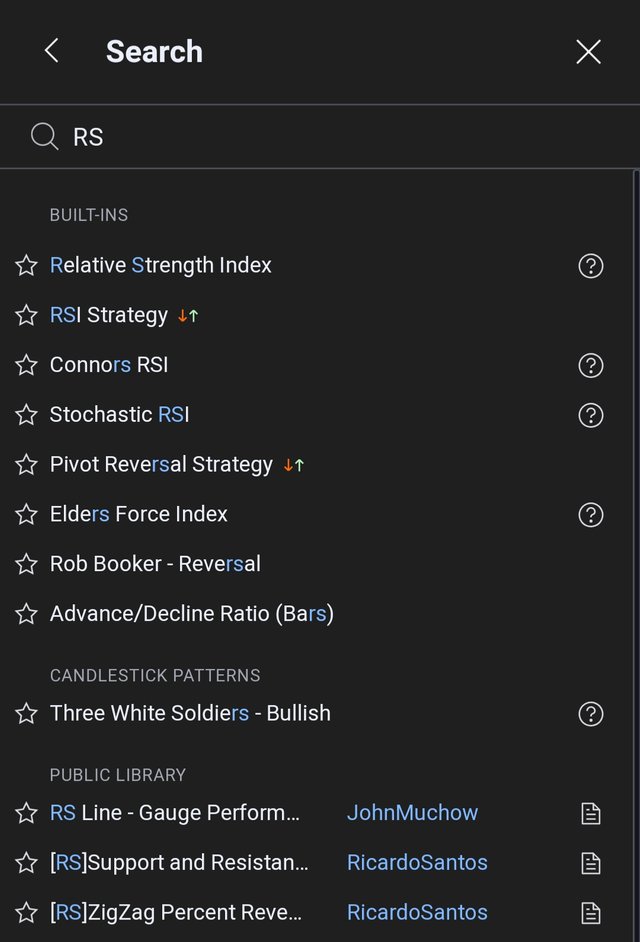
As shown in these screenshots, you can add it to your graph by searching for the indicator you want to add in the search bar.
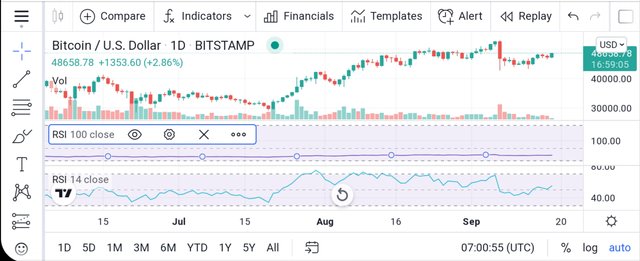
After apply RSI indicator
How to configure them
You can get the setting by clicking on the indicator you added on the graph. It is as in the screenshot below.
Then clicking on that setting will pop-up a page with three headings.
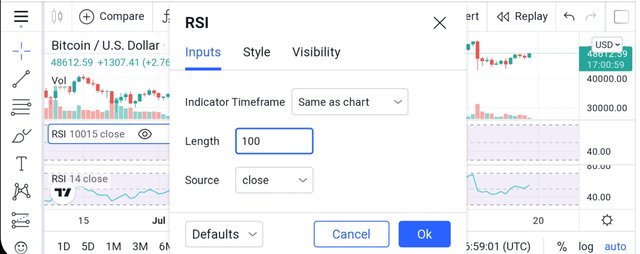
Commands under the Inputs tab
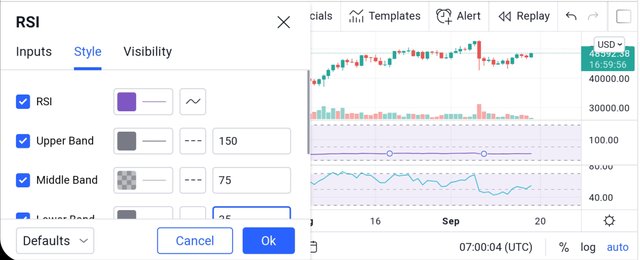
Commands under the style tab
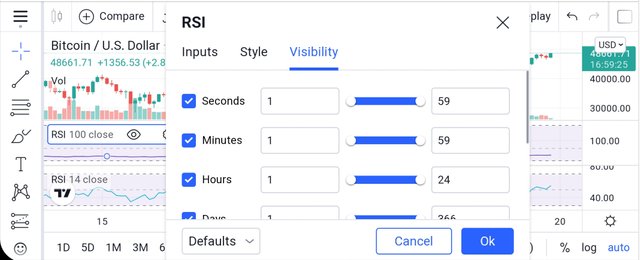
Commands under the visibility tab
You can then configure the indicator by giving the commands under these three headings as you wish.
After configure them
2️⃣ a) Explain the different categories of Technical indicators and give an example of each category. Also, show the indicators used as an example on your chart. (Screenshot needed).
There are different types of indicator categories. Traders can trade by selecting indicators that are appropriate for their trade. Those indicator categories are,
✔️Trend based indicators
✔️Volatility based indicators
✔️Momentum based indicators
The very name trend-based means that this indicator is a category of indicators based on trend. It is possible to find the direction of proliferation by comparing the prices of an asset. That is, it is possible to determine whether an asset is going up or down in price. A trade that goes against the trend can lead to losses. That is, when there is a tendency for the selling price of an asset to rise, if the trade takes place at a lower price, it will result in a loss. Examples of trend indicators are,
• Moving Averages
• Moving Average Convergence Divergence (MACD)
• Parabolic SAR
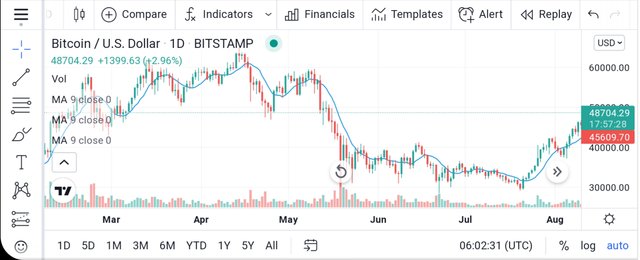
Apply moving average indicator - BTC / USD graph
For example, I added the moving average indicator to the BTC / USD graph.
Market prices are always volatile. That is, there will be constant fluctuations in the price of assets. Indicators used to measure market price fluctuations are called volatility indicators. For the seller, it is advantageous to sell the property when the price of the property is high, and for the buyer it is advantageous to buy it when the price of the property is low. Indicators related to price fluctuations in this way are conducive to trade decision making.
Examples of volatility based indicators,
• Bollinger Bands
• Average True Range
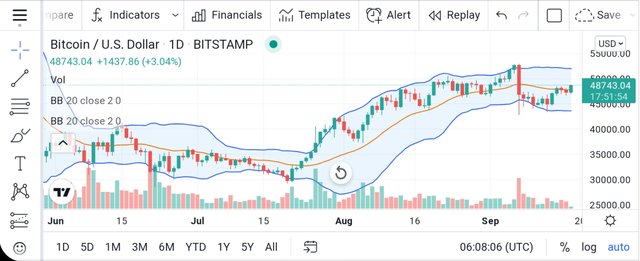
Apply bollinger bands indicator - BTC / USD graph
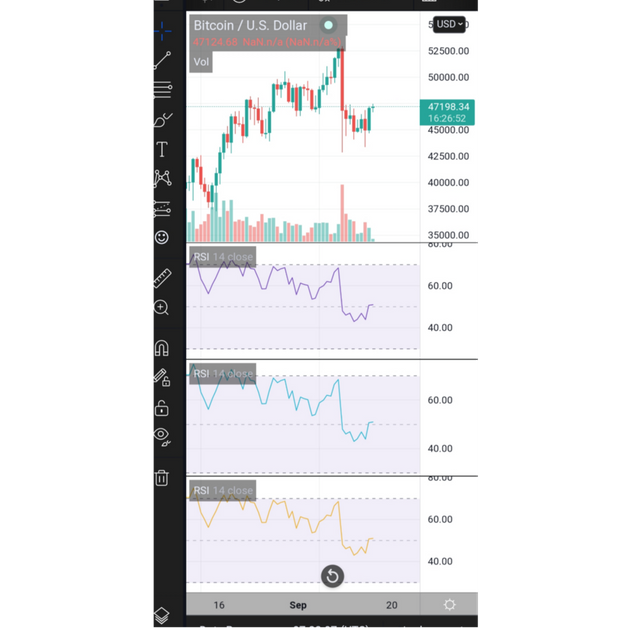
Momentum-based indicators oscillate with the forces of supply and demand in a market, and these indicators help investors make a profit with the price of an asset. Traders can use momentum-based indicators to find the price movement levels of a high-priced asset and a high-selling asset. Such indicators also determine the extent to which an asset price has changed. The Relative Strength Index and the Stochastic Index are examples of this category.
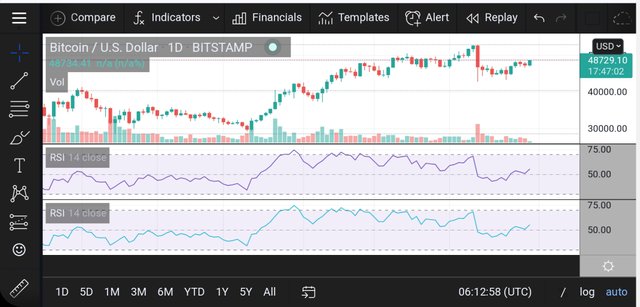
Apply relative strength index - BTC / USD graph
(All screenshots used above are from tradingview.com.)
b) Briefly explain the reason why indicators are not advisable to be used as a standalone tool for technical analysis.
There are pros and cons to anything. There are also disadvantages to using indicators. Indicators do not always provide accurate information. The use of indicators also causes market transactions to lag. If a person who is unfamiliar with the use of indexes, that is, a first-time user of indicators goes for analysis using a single indicator it will not be able to transact correctly. You also need to have knowledge of how to use indicators. For such reasons it is inappropriate to use indicators as an independent tool in industrial analysis.
c) Explain How an Investor Can Increase the Success Rate of a Technical Indicator Signal
I think the best way for an investor to increase the success rate of technical indicators is to use several indicators at once. It can prevent many of the shortcomings that can occur. The winning rate for using multiple indicators is higher than the winning rate for using one index. It is not difficult to select suitable indicators as there are different indicators in the same category.
There are many indicators under different categories, but it is not advisable to arbitrarily use indicators without an understanding of them. This is because in order to increase the success rate of the indicators, matching indicators must be added to the corresponding graphs. It is also important to use indicators that are appropriate to the situation. It is a loss to trade using indicators that do not match the occasion and the chart. In addition, it has to face adverse consequences.
Thanks for reading
Cc :- @reminiscence01
Hello @nishadi89, I’m glad you participated in the 2nd week Season 4 of the Beginner’s class at the Steemit Crypto Academy. Your grades in this task are as follows:
Recommendation / Feedback:
Thank you for participating in this homework task.
Thank you so much professor.