[Crypto Trading with Price Action] - Crypto Academy / S6W2- Homework Post for @reminiscence01
It'd great to be here once again, this is the week 2 of season 6 and it has been exciting so far. the lecture was great and without wasting much time let's dive into the work for today.


Fundamental analysis is important because it helps to give traders insights on the project's founders and investors as well as key financial facts about the project so that you can figure out if their project will be successful for these reasons. Technical analysis focuses on looking at charts indicators and patterns in order to predict price movements and the behavior of the asset. Sentiment analysis looks to see what other people are saying about your chosen project by checking social.
For many analysts, fundamental analysis is the compass for successful crypto trading. But this method is not enough to find exact demand and supply points as well as identifying what motivates traders. Standard risk management policies need to be adjusted in order to make trading feasible.
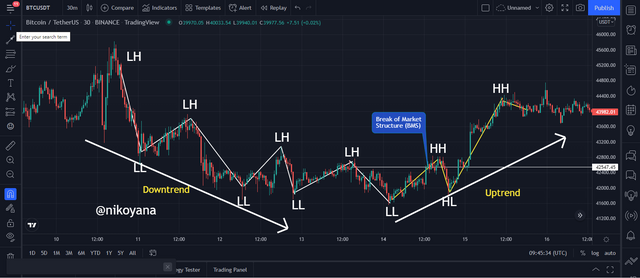
In trading, traders use technical tools and charts to study past price behavior to predict the future price movement. In the market, traders analyze a group's psychology and current level of selling and buying to try to predict whether the trend will continue or end. Using price action, it’s possible to take one small piece of data from history and extrapolate something about the future.
Head and shoulder patterns are part of price action that happen at the end of a bullish trend. For example, traders often get ready for a bearish movement when this pattern appears at the top of their charts. Traders will be closing their positions when the head and shoulders appear. When these patterns happen, there is usually massive selling pressure indicating a change in direction.
Traders can make secure trading decisions and use the price action to make them. It enables skilled traders to identify a point of entry and exit in the market, while also providing a sell order after retesting resistance. For example, you could target support after recognizing that a stop-loss has been hit and place a take profit order on your desired level.
Over many years of use by expert traders, price action has proven itself to be an invaluable tool for both beginner and expert.
One advantage of a crypto trading with price action is that it can quickly identify where the supply and demand is on the market, which in turn can help traders predict future economic patterns.
one can easily gain insight and a deeper understanding of what buyers and sellers are doing in market, including their psychology and emotion, by using price action patterns.
The techniques of price action can help traders filter both noise (market manipulation or technical indicators that lag behind) and false" signals in the market. They are useful for this, as human investors or pro traders typically have a predetermined trend before making a trade.
Traders use a variety of strategies when it comes to analyzing with price action. Some traders will only view one chart while other traders monitor multiple charts and chart periods.
In the trading world, chart patterns show the various scenarios of forces of supply and demand. If an asset has a greater demand than supply on its price, then it will increase. Whether you’re knowledgeable about the forces of supply and demand, or not, it is interesting to see how they play out on charts.
Predictions are made easier by the use of charts in order to get a baseline of distributions so that you can elaborate your prediction from various perspectives.
The most popular trading charts are the ones that show psychological movements including those from a candlestick chart. It is flexible and can be easily read to provide detailed views of trading interactions between buyers and sellers in "market psychology."
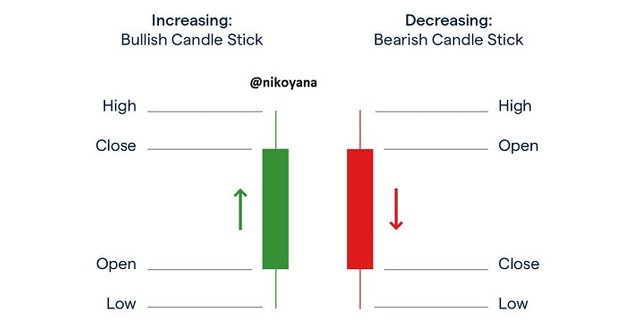
Looking above, we can see the bullish and the bearish candle rightly labelled out. A bullish candle means that the most recent price is higher than the opening price with a red candle, while the opposite is true for a bearish candle. Candlestick's default colors are green for the bulls and red for the bears but traders can adjust or customize them to their preference.
Understanding what candles display can help traders make more informed decisions. With a quick glance, an open, close, high and low can be observed in each trading candle. A candle's body tells how much momentum has been present in the market. More prominently, the wick or light behind the current trade helps decipher what has occurred within a set point in time.
Crypto traders can use the candlestick pattern as a way to predict what is going to happen next during a trade. This can help traders predict and prepare for potentially profitable opportunities in the market.
Depending on the market and level of understanding, traders should analyze prices using single or multiple timeframes. Using these complete data points is important for making informed decisions about buy/sell strategies.
Traders analyze the higher time frames, like weekly, daily and 4 hrs, to capture a more global directional bias or general bias. The trader then performs technical analysis on a lower time frame to find an accurate entry and exit point in the market.
Let's state the Importance multi-time frame analysis
Crypto traders use price action to define and identify key areas in the market which may influence future trading decisions. These key areas are often identified in higher timeframes such as daily or weekly and are well researched with the use of multiple timeframes that help traders to identify trends.
Multiple timeframes help to better manage risk. Using multiple time frames also reduces the number of potential risks for the trader.
When trading with price action, you can use multiple time frames to track the pricing of your chosen cryptocurrency. For example, when using a daily timeframe, watch for possible resistance zones that could result in limited stop losses, which can be mitigated by using a two-hour time frame as well.
Multiple time frames can provide much more significant insight and visibility into the market, especially when trying to spot hidden detail. Traders use multiple time frames in order to see if there is any structural patterns or candlestick patterns that they may use to take a trade decision.
The cancellation of noise in the market is aided by looking at multiple time frames.
In this question, I will be analyzing multiple timeframes of an asset to show a better entry and exit position on the chart
1 DAY TIME FRAME
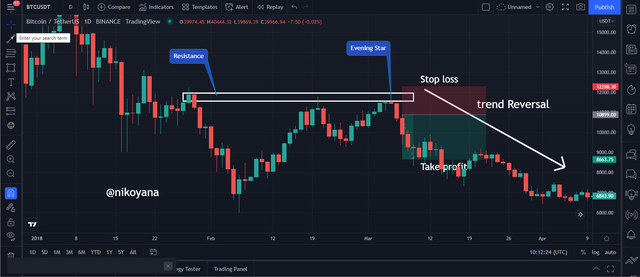
From the BTC/USDT chart above, on a 1 day time frame, we can see that the chart started on a bullish trend and ascended upwards until it encounters a resistance and retraces downwards forming a neckline on the pattern this in turn created a double head alongside showing the evening star which is a reversal signal at a 1:2 RRR to ensure maximum profit on the chart.
4HOURS TIME FRAME
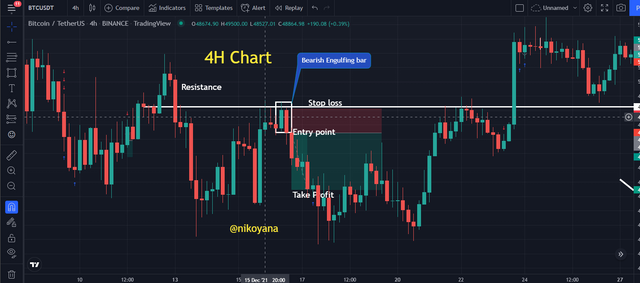
Still on the BTC/USDT chart but this time on a 4Hr time frame, we can see from the chart that the trade was initiated as soon as the engulfing bar was formed. I placed my stop loss and take profit at a 1:2 RRR to ensure profit.
1 HOUR TIME FRAME
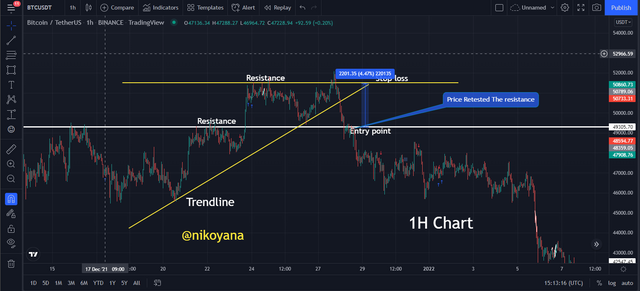
On the 1hr time frame, we can see I used a wedge principle to determine the entry as soon as the price broke below the trend line its a good point for entry, but it is advisable to wait until it breaks the second resistance line the you make an entry. and place the stoploss above the resistance line.
15 MINS TIME FRAME
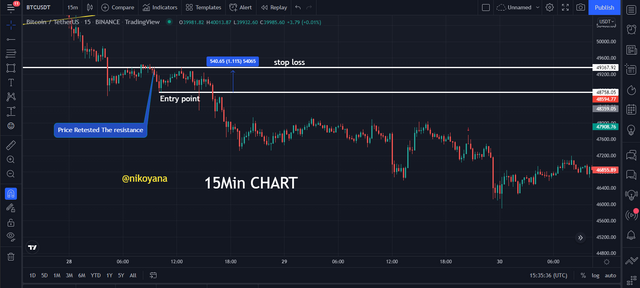
From the chart above on a 15mins time frame, we can see the chart started on a bearish trend and reached a support, where it bounces up for a bullish trend but gets to a resistance. the trade was initiated as soon as the price retests the resistance and breaks through the support in a downward movement an entry was made with the stop loss place above the resistance line.
I will be using the BTC/USDT chart for this analysis
4 HOURS TIME FRAME OF BTC/USDT
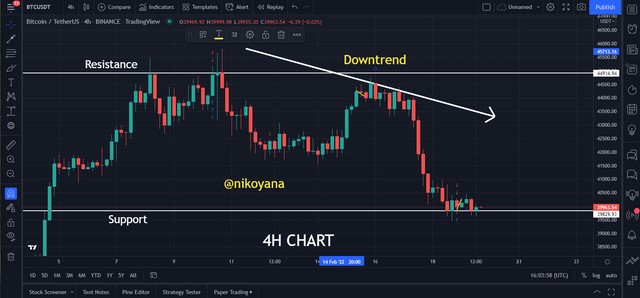
On the chart above on a 4hour time frame, you can see a bearish movement on the chart with a downward trend. I immediately marked for a sipport and resistance level then moved to the next time frame.
1 HOUR TIME FRAME OF BTC/USDT
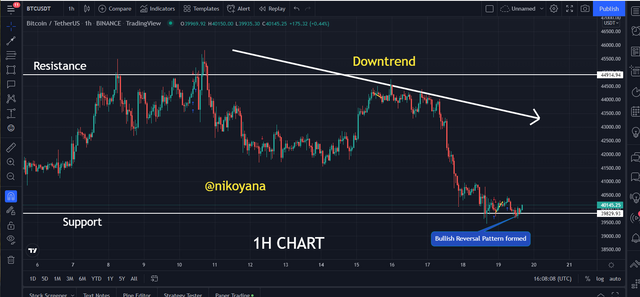
After marking the support and resistance on the 4 hour time frame, I switched to the 1 hour time frame and I noticed that a bullish reversal pattern was formed on the 1 hour chart which is a confirmation that a bullish trend will soon begin.
15 MINS CHART
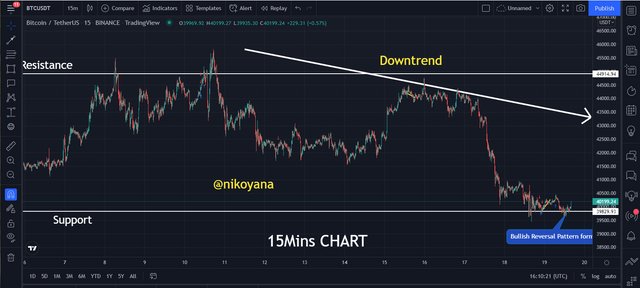
On the 15mins chart above, we can see that the bullish trend become more visible as it progresses upwards with small interval. so let's switch to the 5 mins chart
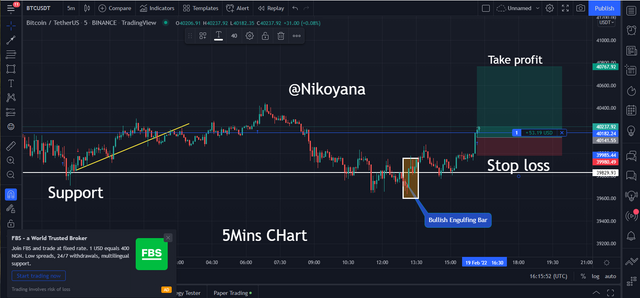
5 MINS CHART
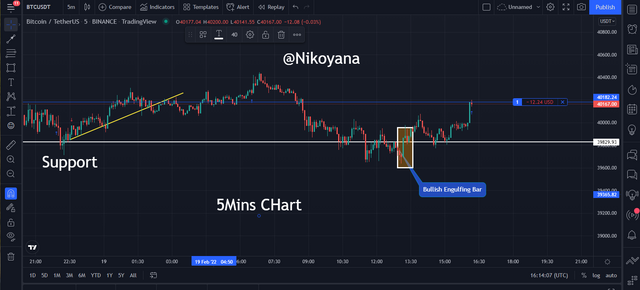
On the 5mins chart as we can see above, I marked out the bullish engulfing candle and we can see that the bullish trend looks promising, so I initiate a trade on my paper trading having this bullish trend confirmation
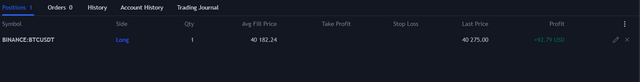
The screen shot below is the execution of the trade and we can see the profit is mindblowing.
With the price action on a chart, you can use historical data to predict the direction of price of an asset. Traders need to know how this technique works in order to successfully trade.
Learn more about cryptocurrency technical analysis and give your risk-taking a boost by using Japanese candlesticks charts if you use them correctly. Learn how to use different time frames and stay ahead of the herd by filtering out noise.
Professor @reminiscence01 made me realize that I knew a lot less than I thought about crypto trading.
IMAGE REFERENCE: Tradingview
Hello @nikoyana, I’m glad you participated in the 2nd week Season 6 at the Steemit Crypto Academy. Your grades in this task are as follows:
Observations:
Impressive analysis, but I suggest your stop loss be place slightly below the support zone
Recommendation / Feedback: