Leverage with Derivatives Trading Using 5 Mins Chart - Steemit Crypto Academy S6W1 - Homework Post for Professor @reddileep
It's a great privilege to be here for the long awaited season 6 of the academy and today we have a beautiful lecture by Professor @reddileep on Leveraging Trading of Derivatives with the 5 minute chart
due to google translate there may be few errors bur I will try my best to make it very minimum and much simpler to understand. having said this, let's dive into the business of the day.


Leveraged trading is difficult for beginners, but also helps professional traders with high risk tolerance and risk management. Used by professionals to minimize commissions and fees and maximize profits, the power of leverage has great potential to make profit on investments
Traders can leverage trading to buy assets up to 5 times, larger than what they can afford. However, you may lose everything if the trade moves against your position. Leveraged trading utilizes trading as an intermediary between buying and selling of securities to amplify the investment power available with a limited amount of capital.
Leveraged trading using derivatives trading, also known as margin trading, can be a great way to make lots of money with little capital if your prediction is correct. However it can get bad when the market goes against your prediction. Your account might be liquidated if you don't deposit enough to cover up your losses.
Leveraged trading using derivatives trading using 5 Mins charts allow you to make profits in both uptrend and downtrend regimes. For example, if there is a surge in the market which actually leads to up and not down, it would be possible to make a profit as well as when there is another downward cycle vice versa.
Leverage enables the smaller investor to imitate the successes, but there are many levers to use to make trades.
Leveraged trading is used as a strategy for those who participate in the cryptocurrency market. In this section, we will examine how leveraging has become part of popular investing strategies and its benefits.
Leveraged trading with derivatives is a kind of trading that utilizes small profits from a quick movement in price. The trader earns a high profit after a short trade movement.
Trading derivative instruments by using leverage also has its benefits. Leverage allows user positions to be closed in either partial positions or the full position, should they be in collateral cash-flow positions. keeping the position open
Leveraged trading makes it easy to add more funds to positions on dips or corrections and with the cross margin which enables traders to lock in account value while reducing the risk of liquidation.
Leveraging your trades with derivatives increases the amount of what you have to invest by up to a great deal of percentage. You can use this leverage increase to trade or invest a larger sum with little capital. This allows those with low funds to diversify and maximize their opportunity in the market, as traders can now leverage almost 50x their investment for increased profits.
Derivatives trading using 5 minutes charts might seem exciting, but let’s look at the disadvantages.
Leveraged trading has high risk and can cause losses much faster than in spot trading.
When trading, funds are borrowed to generate more profit, however this borrowing magnifies the loss as well and when losses are done quickly it leads to high liquidation.
Leveraged trading seems like a great alternative to spot trading, but when considering the fees for holding your position and even overnight holds. Leveraged trades come with much more trading fees which is a big disadvantage.
It is possible to lose a lot of funds in this leveraged trading, so it's important to track your stop-loss to avoid quick liquidations from happening but when a trader forgets to use the stop loss he can go into liquidation.
Leveraged trading is a risky type of trading that often leads to the loss of more than you intended. Before any crypto trades are made, traders should first read articles on new charting techniques which will help them search for opportunities in the trend direction. This includes using carefully chosen indicators like Exponential moving average (EMA), Parabolic SAR, Supetrend, Moving average convergence divergence(MACD), Relative Strength Index (RSI).
RSI(Relative Strength Index)
The RSI, or Relative Strength Index, is used for technical analysis and can be useful in spotting price fluctuations. It is typically advises by showing region of over bought when the RSI rises above 70 as this means there is likely weakness and exhaustion in the current uptrend (inevitable bullish price movement). Similarly, it's advises by showing region of oversold when the RSI falls below 30 as this means there is likely weakness and exhaustion in the current downtrend (inevitable bearish price movement).
The marked out area is an example of the RSI indicator showing the region of oversold where the price falls below the 30 mark of the RSI indicator
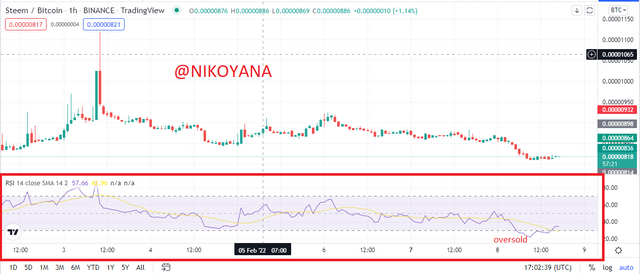
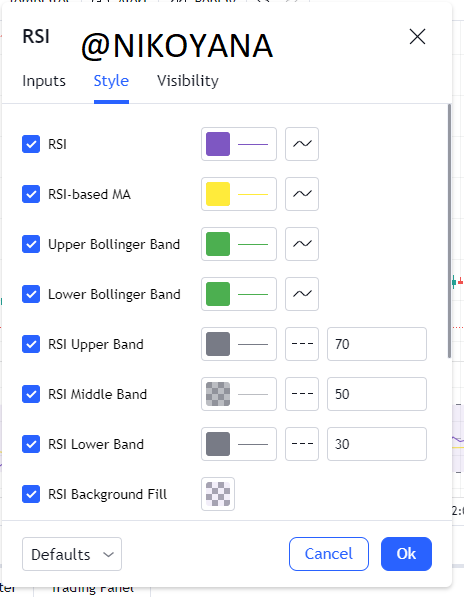
Also the style and settings of the RSI indicator can also be changed and adjusted to the taste of the user
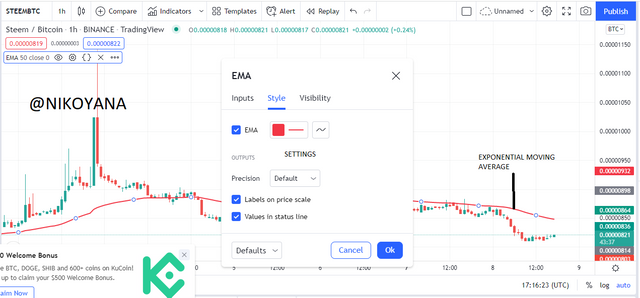
EXPONENTIAL MOVING AVERAGE(EMA)
In leverage trading, the exponential moving average (EMA) is a momentum indicator—meaning that it calculates weighted candlestick data that estimates how fast shares are turning over. It's best to use the 5-minute chart with the EMA because trading decisions need only be made every few minutes to avoid lag. This means there is a much smaller chance of a slowdown affecting profitability.
When traders want to use a time efficient strategy for derivatives trading, they watch the 5 minute price chart. The direction of a trend can often be gleaned from whether price trades above or below an EMA, and from how it receives price reversals.
For our analysis in this study, we will be adding an EMA with a 50 period. This helps us to take into account price data points over the last 50 days. You can decide to change the EMA color depending on your trading strategy.
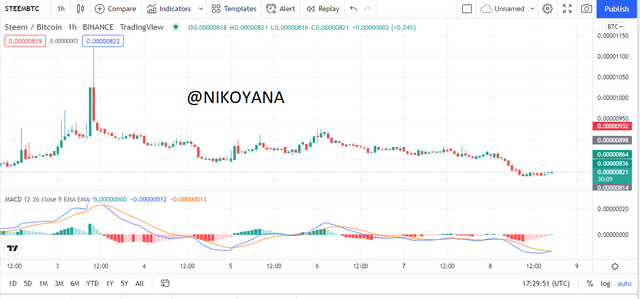
Moving Average Convergence and Divergence (MACD)
The Moving Average Convergence and Divergence can predict the trend of a particular trade and is also an oscillator with a band. The MACD fluctuates upwards and downwards the zero line in the histogram.
When the MACD line is above Zero for a certain period, it is clear that the market is trading in an up-trend and when the MACD line is below Zero for a given period, it is clear that the trade is in a down-trend. MACD has two lines, the MACD line and signal line. In most cases, the MACD line is blue and the signal line is yellow, when the signal line is above a MACD line, then sell signal is activated and vice versa when the signal line is below the MACD then buy signal is activated.
I always recommend trading on a five-minute chart to make the use of leverage riskier. The idea is that every trade has more volatility at lower time frames, so any single pip can cause bigger changes in the total capital. Never increase the risk of an already unstable return on an equity market.
Leverage with Derivatives Trading Using 5 Mins Chart For optimal trading, you can With derivatives, you don’t need to pay the full amount up front like when buying equities. Instead, traders who are selling futures contracts effectively act as lenders. This way, you know how much money you will owe before opening the trade. However, for this strategy to work properly, it will be necessary to switch to Heikin Ashi charts and utilize a 5mins chart
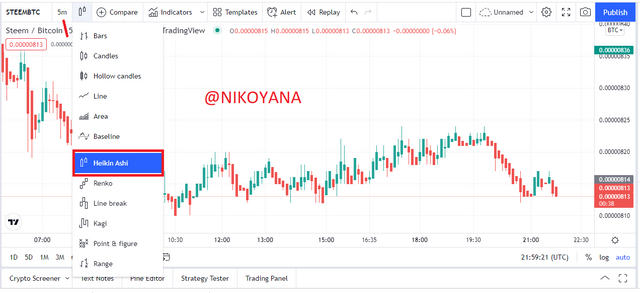
Heikin Ashi charts often capture larger swings than standard candlesticks graphs. A variation of this chart is its 5 minute time frame.
FOR A BUY POSITION STRATEGY
for this section we will be using 3 indicators to confirm our buy position which is the EMA, PARABOLIC SAR, RSI
Along with an uptrend and Parabolic SAR below the price level, the trader looks for a Buy position. The first thing to consider is seeing if the EMA on the 5-minute chart reveals trending direction to be bullish. If so, we look for a Buy position also confirming that the parabolic sar dotted lines are below the price level.
The buy signals on the Parabolic SAR and the EMA are confirmed with the RSI indicator. Take a buying long position if the RSI is below our middle line (Below 50 threshold).
When reading the price curve, you should be looking for three time periods in which all of the three indicators are pointing to determine if there's a buy position. The image below showcases an obvious buy.
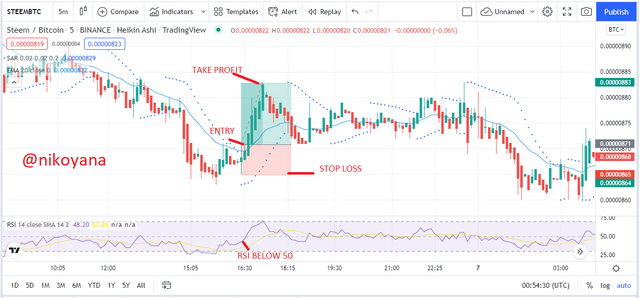
The above STEEM/BTC chart on a 5mins time frame, we can see the EMA signifies a bullish trend and the parabolic sars also confirmed by creating dotted lines below the price. the RSI was also below the 50 threshold having all three indicator in confluence, I placed the stop loss at a 1:2 RRR and took profit as soon as the parabolic dotted lines changed direction
FOR A SELL POSITION STRATEGY
Along with a downtrend and Parabolic SAR above the price level, the trader looks for a sell position. The first thing to consider is seeing if the EMA on the 5-minute chart reveals trending direction to be bearish. If so, we look for a sell position also confirming that the parabolic sar dotted lines are above the price level.
The buy signals on the Parabolic SAR and the EMA are confirmed with the RSI indicator. Take a selling position if the RSI is above our middle line (above 50 threshold).
When reading the price curve, you should be looking for three time periods in which all of the three indicators are pointing to determine if there's a sell position. The image below showcases an obvious sell.
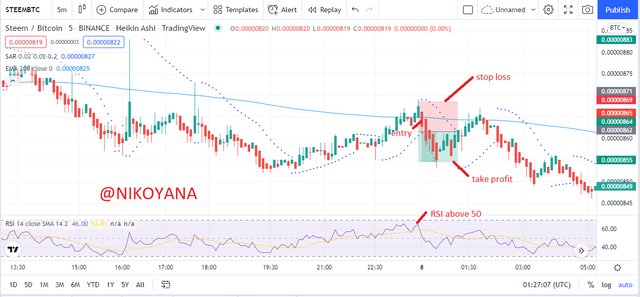
The above STEEM/BTC chart on a 5mins time frame, we can see the EMA signifies a bearish trend and the parabolic sars also confirmed by creating dotted lines above the price. the RSI was also above the 50 threshold having all three indicator in confluence, I placed the stop loss at a 1:1 RRR and took profit as soon as the parabolic dotted lines changed direction.
I will go over my full analysis of the position on Tradingview.com. Then, after executing my trade on Binance, I will demonstrate how I conducted trading of the derivative position with RSI,EMA,PAABOLIC SAR
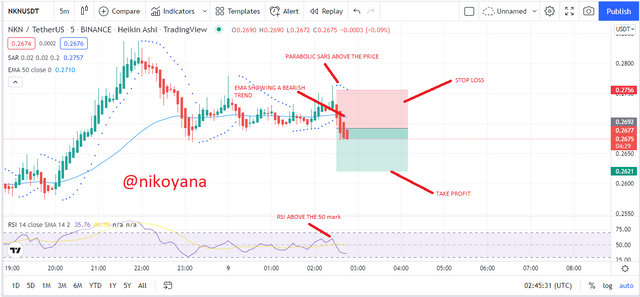
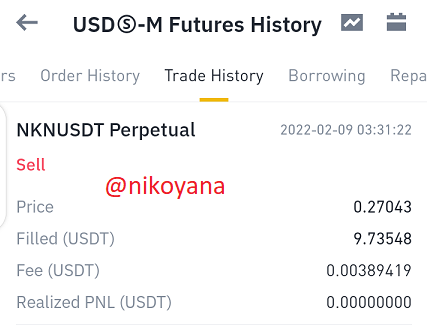
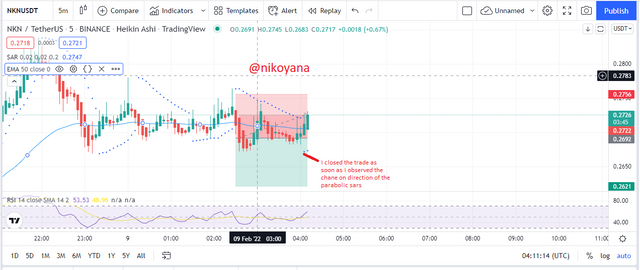
After analyzing the 5-minute chart of NKN/USDT, I noticed that the price is trading below the 50 EMA, signalling a bearish trend. My parabolic sar also showed that the dotted lines are above the price of the asset . Finally, RSI analysis shows the right strategy to help trigger an operation by having it's reading above the 50 threshold.
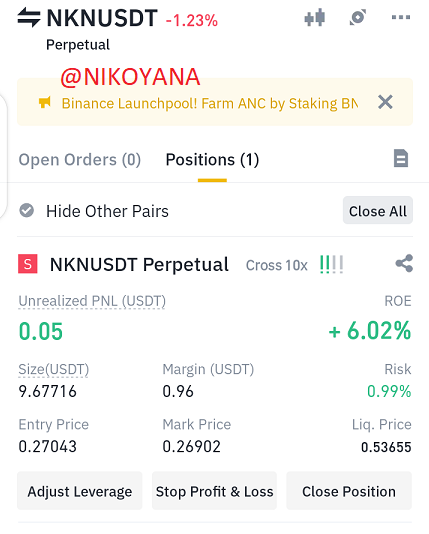
we can see all these informations marked out on the chart below, so I set my stop loss at a 1:1 RRR and I head over to binance to make my trade at a cross margin of 10x
the screenshot below are the details of the leverage trading on binance which is still in progress. I will exit the trade as soon as I see a change in the parabolic sars direction.
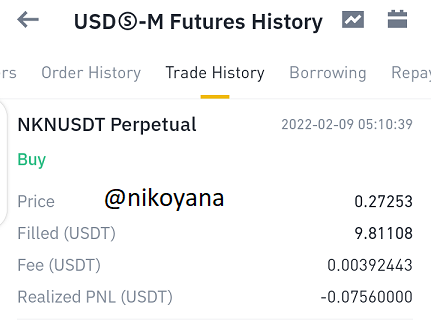
after some time I discovered a change in direction of the parabolic sars and I immediately closed the trade
Leverage trading is risky. For example, one study found that leverage traders lose money at a rate 20% higher than normal traders. We have discussed the benefits and disadvantages of leveraged trading. Additionally, we have highlighted several strategies that can aid traders in achieving satisfactory results while utilizing this style of trading. You may utilize sar, ema, or rsi confluence to make sound investment decisions with your trades
Leveraged trading offers enticing benefits that traders might overlook the risks involved in trading with leverages. Making good use of risk management is necessary. I believe this study will serve as a guide in making good investment decisions in leverage trading. You should always invest what you can afford to lose while trading leverages, since they are expensive options associated with increased potential profits.
Best Regards @reddileep, it was really insightful and I learnt alot
IMAGE REFERENCE: WWW:TRADINGVIEW.COM
