# Crypto Academy Season 03 - Week 08 | Advanced Course - Trading Sharkfin Pattern for @cryptokraze by @mustafaasif
I have tried my best to explain every task while keeping it as concise and to the point as possible in accordance with the rules.
✪Question no: 01

✪ BASIC DEFINITION:
If we put it simply, Sharkfin pattern is a display of a sudden reversal in either a continuous upward or a continuous downward trend of a coin’s price.
✪ INDICATION ON THE CHART:
It is indicated in the form of letter V on the chart when there is a reversal in the continuous downward trend, and indicated in the form of the inverted letter V on the chart in case of a reversal in the continuous upward trend.
✪ EXAMPLE OF SHARKFIN ON CHART:
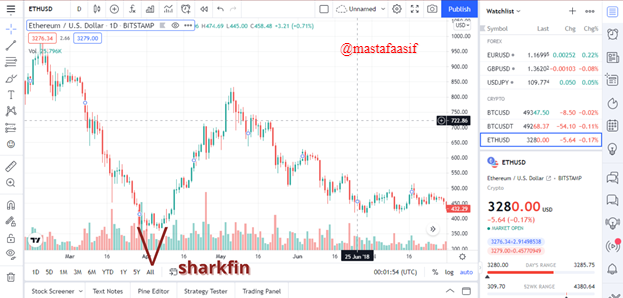
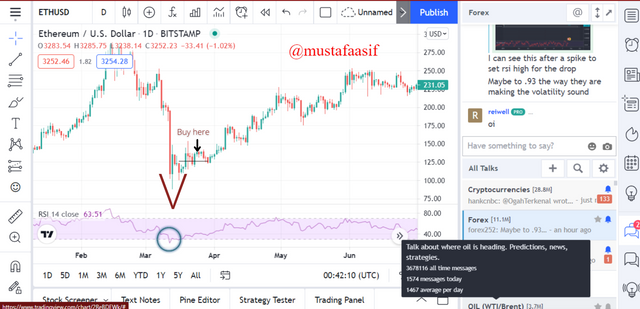
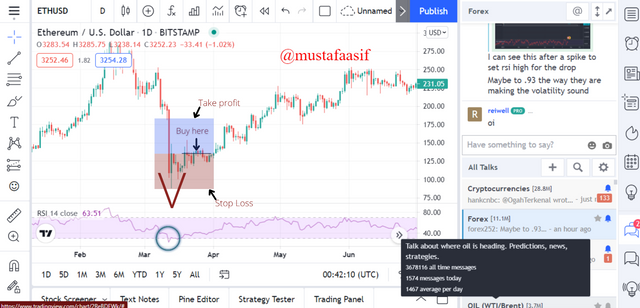
In the figure below, an etherium chart visualizes the sharkfin pattern which is indicated by the V shape, a sudden reversal of price from downward trend can be clearly seen in the below chart.
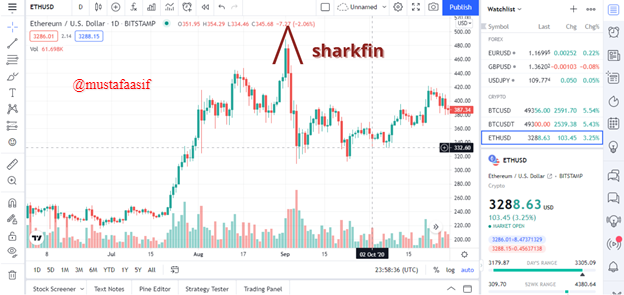
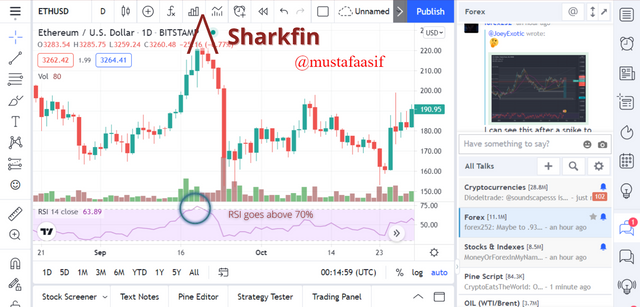
Meanwhile in the below figure, an etherium chart visualizes the sharkfin pattern which is indicated by the inverted V shape, a sudden reversal of price from upward trend can be clearly seen in the below chart.
✪Question no: 02
✪ Spotting Sharkfin pattern with RSI indicator:
Even though the above charts provide a clear picture of how the sharkfin pattern can be spotted and it looks quite lucrative to trade on its basis, but there is one more element that we must consider in order to exactly spot the sharkfin pattern.
This element is RSI (Relative Strength Index) indicator. By incorporating RSI indicator, spotting sharkfin pattern becomes a lot easier.
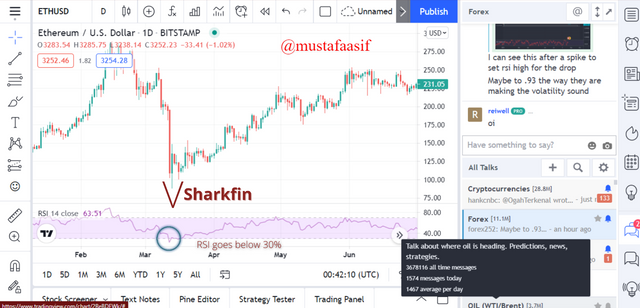
The recommended lower limit is 30% RSI, if it falls below 30% and take a turn to come back again above 30%, it indicates the downtrend reversal of sharkfin pattern. This phenomenon can be observed in the below chart.
Meanwhile the recommended upper limit is 70% RSI, if it goes above that and take a turn to come back below 70%, it indicates the uptrend reversal of sharkfin pattern. This phenomenon can be observed in the below chart.
✪Question no: 03
✪ Entry criteria for Buying:
The entry criteria of Buying is pretty simple. After applying the RSI indicator on default settings, look for a sudden reversal in the downward trend making a “V” shape pattern.
After that make sure that the RSI has been below 30% and then got back above 30% making a sudden reversal portraying “V” shape pattern.
And then make a purchase after RSI clearly hits above 30%.
We wait for the RSI to go above 30% because there is a further chance of downfall
✪ Entry Criteria for selling:
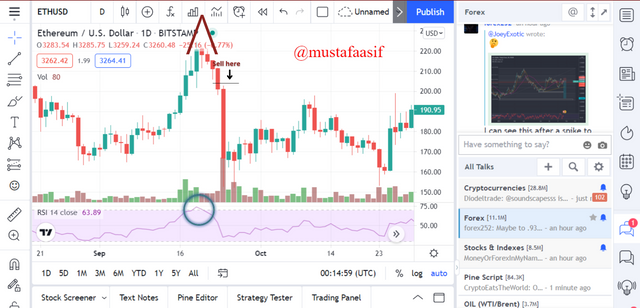
- After applying the RSI indicator on default settings, look for a sudden reversal in the upward trend making an inverted “V” shape pattern.
- After that make sure that the RSI has been above 70% and then got back below 70% clearly making a sudden reversal portraying “V” shape pattern.
- And then make a sell order after RSI hits below 70% clearly.
- We wait for the RSI to go below 70% because there is a further chance of upward trend
✪Exit criteria for buying:
- We should set a Stop loss level, so in case our trade decides to oppose our hopes and takes a wrong path we can minimize our loss.
- Level for stop loss should always be below the lowest swing of Sharkfin pattern (V shape)
- In case the price crosses the stop loss level, it indicates that the trade has taken a wrong path and we must wait for next opportunity now.
- Likewise, we should set up a take profit level in the case of desired path of our trade.
- It is recommended that the level for take profit should be in the ratio of 1:1 to the level of stop loss in the starting until one gets a perfect grip on this strategy, this will make both the levels equal indicating the same ratio of risk and reward.
- In case the price hits the take profit level, one can book profit and exit from trade.
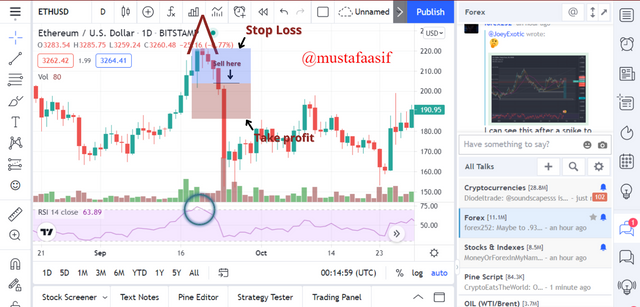
✪Exit criteria for selling:
- We should set a Stop loss level, so in case our trade decides to oppose our hopes and takes a wrong path we can minimize our loss.
- Level for stop loss should always be above the highest swing of Sharkfin patter (inverted V)
- In case the price crosses the stop loss level, it indicates that the trade has taken a wrong path and we must wait for next opportunity now.
- Likewise, we should set up a take profit level in the case of desired path of our trade.
- It is recommended that the level for take profit should be in the ratio of 1:1 to the level of stop loss in the starting until one gets a perfect grip on this strategy, this will make both the levels equal indicating the same ratio of risk and reward.
- In case the price hits the take profit level, one can book profit and exit from trade.
✪Question no: 04
✪DOGE/USDT ENTRY ON SELLING POSITION:
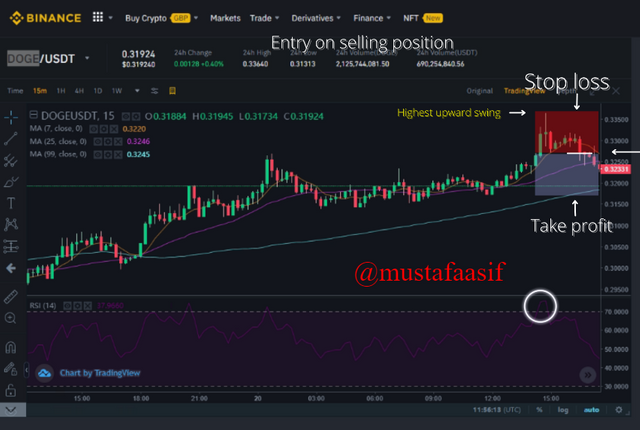
The above screenshot depicts my trade in doge/USDT based on the sharkfin pattern verified by RSI indicator. I made a sell order when I saw a sudden reversal in the upward trend and verified that RSI has dropped below 70% after going above that. I placed a stop loss at the highest swing and placed the take profit on the same ratio in order to keep the risk-return ration at 1:1.
✪TRX/USDT ENTRY ON BUYING POSITION:
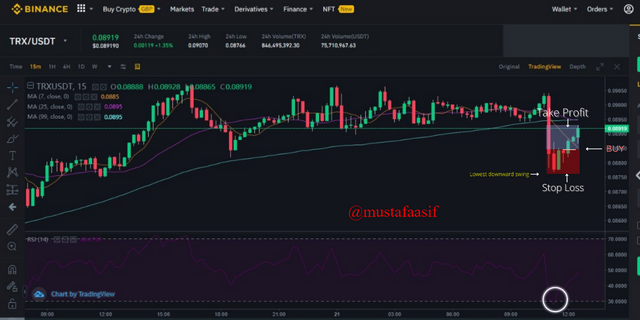
The above screenshot depicts my trade in TRX/USDT based on the Sharkfin pattern verified by RSI indicator. I made a buy order when I saw a sudden reversal in the downward trend and verified that RSI has has gone above 30% after going below that. I placed a stop loss at the lowest swing and placed the take profit on the same ratio in order to keep the risk-return ration at 1:1.
✪Conclusion
It was a great learning experience provided by Professor @cryptokraze . We learned about how to spot sharkfin pattern and how to trade using this method.
Firstly, we talked about basic criteria for spotting the sharkfin pattern, later we took a view on how to confirm the Sharkfin pattern by incorporating RSI indicator in our analysis.Afterwards, we talked about the criteria for entry and exit point in both buying and selling positions.And finally, to ensure the practicality of the project, I incorporated my real time trades(charts attached) and explained how the Sharkfin Pattern technique can benefit us in making calculated and smart decisions. After all, the ultimate goal of the whole community is to maximize the profits and minimize the losses. #cryptokraze-s3week8 #cryptoacademy #steemexclusive #price-action #sharkfin