Metric Indicators - Crypto Academy / S5W2 - Homework post for pelon53.

Cover Page created by me, @msquaretk | created with imarkup App.
It is another week in the Steemit Crypto Academy. Last week was full of experience from different Professors in the Academy. This post is written in response to Professor @pelon53 's assignment. He taught metric indicator. He explained three different indicator very well; he showed how to read it and entry points. Then, after his lecture, he gave us questions. In this post, I am going to be answering the questions based on my own understanding. Therefore, I urge you to follow me till the end.

1. Indicate the current value of the Puell Multiple Indicator of Bitcoin. Perform a technical analysis of the LTC using the Puell Multiple, show screenshots and indicate possible market entries and exits.

In this first task, I am going to be performing a technical analysis on LTC/USD using Puell multiple Indicator and showing the current price of bitcoin.
Let's quickly see what the indicator is. Puell multiple Indicator is one the newest indicators in cryptocurrency trading. It's used for estimating the profit of mining pool in comparison with the one year historical average. It is calculated by dividing the value in USD of an asset issued per day with the 365days moving average. This means that Puell indicator is dependent on the value of an asset and one year moving average.
Mathematically, Puell indicator = Value of an asset (USD) /365days MA.
The indicator consists of two lines in the indicator window. One line measures the price and the other is Puell indicator itself. Also, there are two bands or stripes, one is at the bottom and the other at the top. The upper stripe is red color which has a scale beside which reads between 5 and 10. While the lower stripe is green in color and also has scale at the left side which reads between 0.1 to 0.5.
When the indicator enters the lower band, it is a signal that the miners capacity is very low. At this point, the investors buy the asset. Also, when the indicator enters the red stripe, the upper stripe, it means that the asset is value and the miners has high probability. Then, Investors sell the asset at this point and take profit on asset they have bought at very low area.
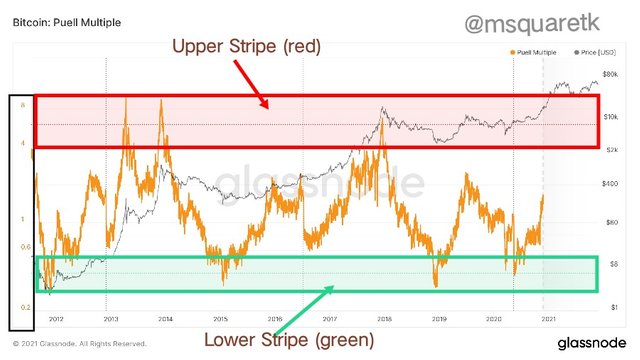
Puell multiple Indicator Chart Source
Now having, seen what the indicator is, let's see the current value of Bitcoin using this indicator.
Indicate the current value of the Puell Multiple Indicator of Bitcoin
As at the time of writing this post (24/11/2021) | 8:00Pm WAT, the current value of Bitcoin is $56, 855.82. We can see according to the chart below that bitcoin is at the neutral zone of the indicator, about 1.15. See the screenshot below.
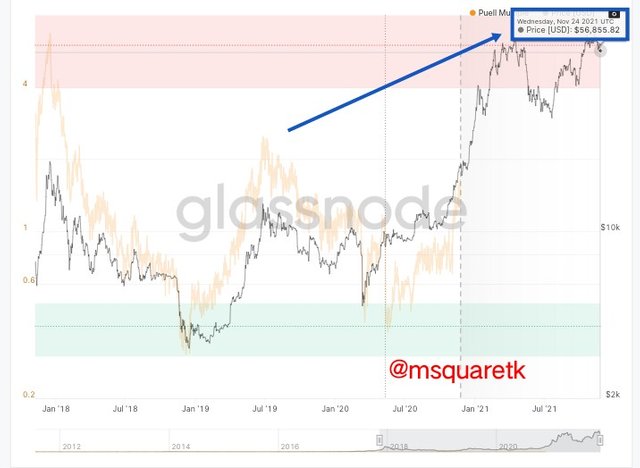
Current Price of Bitcoin using Puell Multiple Source
Perform a technical analysis of the LTC using the Puell Multiple, show screenshots and indicate possible market entries and exits.
Now, I will be doing technical analysis on the pair LTCUSD using Puell Multiple Indicator.
Now, don't forget that there are two stripes which this indicator shows. Upper stripe (pointed at with 2nd arrow) which is red in color which indicates the miners have high probability and the lower stripe(pointed at with 1 arrow) which is green in color which indicates low capacity of the miners.
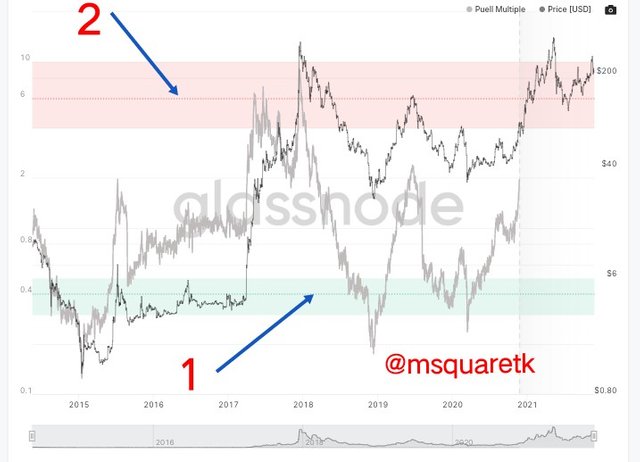
Litecoin Analysis using Puell multiple Source
Now, let's get into the analysis now.
In the year 2015, the indicator crossed the green zone, the lower stripe and of course we know this is a buy signal for investors. The price is around $1 this time. So, the first buy signal came in and the Investors bought litecoin from the said amount up to $6 before the litecoin experienced a major pull back which later entered the lower zone in which the investors accumulated more of the asset at approximate $4. Since then, the investors has been buying the asset up to the red zone, the upper stripe at about $90. The buyers exit the buy trades by selling their the asset and take profit.
Now, in the mid 2017, sellers came in and sold litecoin to approximate $20 before a little buy sent the asset back to the red zone in the year 2018. From that year, litecoin experienced a significant bearish trend. The sellers took control of the asset from the price above $200 and the sell lasts until the year 2019 in which the price close at approximately $25 and at this point the Indicator has entered a green zone which signifies a buy entry for the investors.
From that year 2019, Investors bought litecoin to the mid 2019 at a close of $155 and then the asset turn back to downward side to enter back the green, lower stripe in the year 2020 which gives the investors another chance to invest more.
Since February/March 2020, litecoin has been in an up trend. During the time, the rally movement starts at around the price of $30. From this price, litecoin keep shooting high and in the month of May, 2021, it entered its all time high of $412. For some times, it fell a little to the downside and right now, in the month of November, it is a bit above $200. To be precise, the current value of this asset, litecoin as at the time of booking this analysis is $211.
Now the time will tell if the price will still increase. But as it is now, the Puell multiple Indicator is at the scale of 2. Meaning that it is still yet not close to the upper stripe. The investors still have chance of taking it high up until the Indicator reaches the upper stripe. The exit points for the buy entry should be the start of the upper stripe because at this point, investors usually dispose the asset. It is indicated by *blue horizontal line". While the exit points for sell entry is indicated by a red horizontal line, the end of the lower stripe.
The screenshot below shows what i have explained so far.
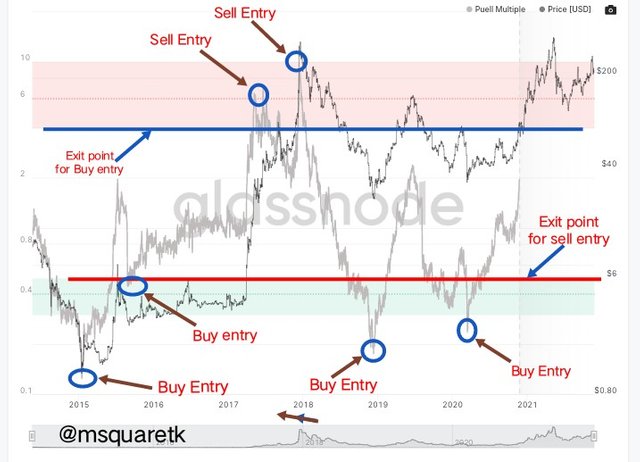
Litecoin analysis using Puell multiple Source

2. Explain in your own words what Halving is, how important Halving is and what are the next reward values that miners will have. When would the last Halving be. Regarding Bitcoin

What is Halving?
For every cryptocurrency, there's what is called miners or validators. In some cryptocurrencies, miners are used while in others validators are used. Miners are people who verify transactions in the ecosystem by solving mathematical puzzles with their resources. Once the transaction is verified, and the block is added to the blockchain, the miners will receive reward for their job done. This reward is called block reward. But, it's designed in way that when it get to a certain period, the reward will be halved. This is where halving comes in.
Halving is the process by which the reward the miners receive in mining is cut into half. For bitcoin, it is when the bitcoin block reward of the miners is halved at every 210,000 blocks. This is usually takes about 4years before the this block is formed because a block is formed at every 10minutes in the bitcoin blockchain.
There have been three consecutive bitcoin halvings since the creation of bitcoin, 2009. And each time this event takes place, the reward of the miners which is known as block reward will be cut into half. This leaves the supply of bitcoin being reduced into circulation.
Importance of Halving
Halving is used to control the supply of coin in circulation. Bitcoin supply is 21 million BTC and once this reaches this, there won't be issuance of the new coin again. We know that when supply of a commodity decreases, it value increases because that commodity will be scarce. So, halving is one the things use to control the supply of cryptocurrency.
As halving takes place, the reward for the miners reduces as well as the number of BTC that's added to the circulation. Though the reward is halved, decreases but the price increases, and this keep miners incentive appreciating. Thus, halving makes the Bitcoin to be more scarce and valuable.
Although the amount of reward given to miners keep reducing by half as the halving occurs but because the price increases, the miners still continue mining because the incentive still pays them. If the price doesn't increase, miners may have stopped mining. We know that the job requires a lot of expensive gadgets to solve mathematical puzzles.
What are the next reward values that miners will have?
In the year 2009 when the first block formed, the miners block reward was 50BTC. During this time, the mining was very easy as the resources or gadgets for mining the bitcoin is not that expensive, it is even said that one computer could mine successfully then. But these days, mining requires expensive gadgets. First halving took place in the year 2012 where the block reward was slashed into two. Then he block reward was 25BTC. Second halving was in the year 2016 and the block reward turned to 12.25BTC. The current reward which the miners are receiving is 6.25BTC and it started from the year 2020 which is the third halving. The next halving, fourth halving will be in the year 2024 when the reward will be 3.125BTC
| Halving Number | Year | Block Reward | Block No. | Number of Bitcoin Issued out |
|---|---|---|---|---|
| Start of the reward | 2009 | 50 BTC | 1 | 10,500,000 BTC |
| First halving | 2012 | 25 BTC | 210,000 | 5,250,000 BTC |
| Second halving | 2016 | 12.5 BTC | 420,000 | 2,625,000 BTC |
| Third halving | 2020 | 6.25 BTC | 630,000 | 1,312,500 BTC |
| Fourth halving | 2024 | 3.125 BTC | 840,000 | 656,250 BTC |
| Fifth halving | 2028 | 1.5625 BTC | 1, 050, 000 | 328,125 BTC |
| Sixth halving | 2032 | 0.78125 BTC | 1, 260, 000 | 164,062.5 BTC |
| Seventh halving | 2036 | 0.390625 BTC | 1, 470, 000 | 82, 031.25 |
This process will continue every four years until the maximum supply of bitcoin is reached. The last halving is expected to be in the year 2140 when the total supply of bitcoin would be 2million BTC.

3. Analyze the Hash Rate indicator, using Ethereum. Indicate the current value of the Hash Rate. Show screenshots.

Hash rate indicator is another important metrics indicator used to by Investors. There is a need for computational operation for cryptocurrencies which use Proof of Work (PoW) consensus protocol. This Indicator determines or measure the the computational power consumed by the miners during the process of validating the transaction.
When there's high computational operation, there's high security in the blockchain. And to have high computing power, there's need for more expensive gadgets which will be able to solve the mathematical puzzles.
Let's consider the graph of Etherum using this hash rate Indicator.
This Indicator comprises of two main lines in it's Indicator window: mean hash rate line and price line. The mean hash rate line reads the hash rate of the asset and the price line shows the price of an asset at the right hand scale.
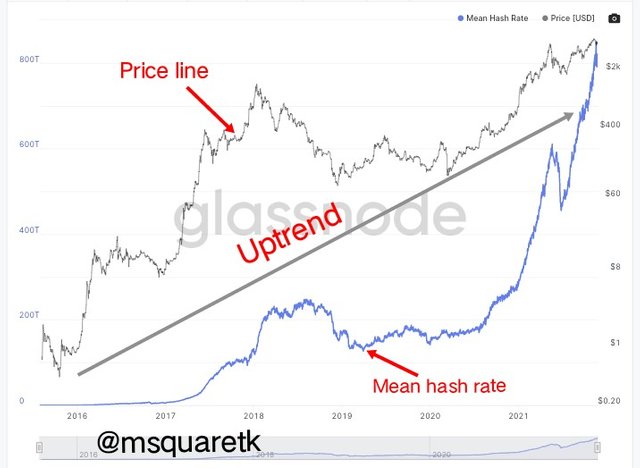
Mean Hash Rate of Ethereum Source
As it is seen in the graph above, overall the hash rate of Ethereum has been in uptrend. Between he year 2016 and 2017 the hash rate is seen almost flat. This shows that mining during this time was not encouraging. But since the beginning of 2017, around march, the hash rate began to rise. From this time to late 2018 the hash rate rose above 200T and to price of about $1k.
Then, a downfall was experienced between late 2018 to early 2019. The price of Ethereum fell below $400k and hash rate went back to 100T. Now, shortly after this downfall, more miners join the pool and as a result the mining will be more difficult because more computational power will be required. From the year 2019 to mid 2020, the hash rate didn't increase that much, but from mid 2020, the hash rate has been increasing rapidly. The hash rate increases from about 100T to 800T from this mid 2020 till now.
Now, let's see the current value of hash rate.
Indicate the current value of the Hash Rate.
As at the time of writing this post 24/11/2021 the current value of hash rate is 704, 143, 638, 773, 111.5/s and the price of Ethereum is $4, 724.5. The screenshot below shows these details.
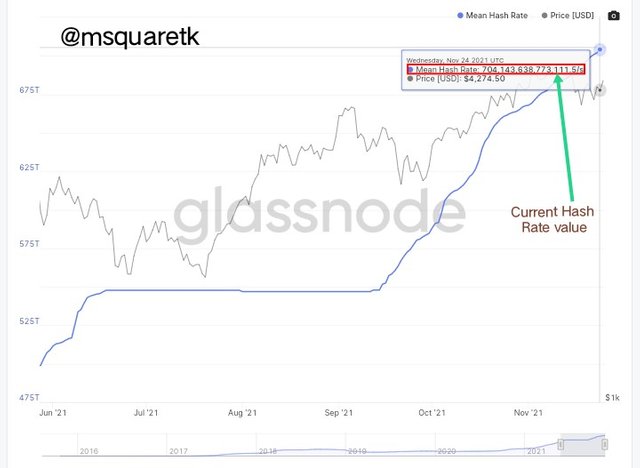
Current Hash Rate value of Ethereum Source

4. Calculate the current Stock to flow model. Explain what should happen in the next Halving with the Stock to Flow. Calculate the Stock to flow model for that date, taking into account that the miners' reward is reduced by half. Show screenshots. Regarding Bitcoin.

In this task, I am going to be calculating the current stock flow as well as the stock flow in the next halving. So let's go straight to the calculation.
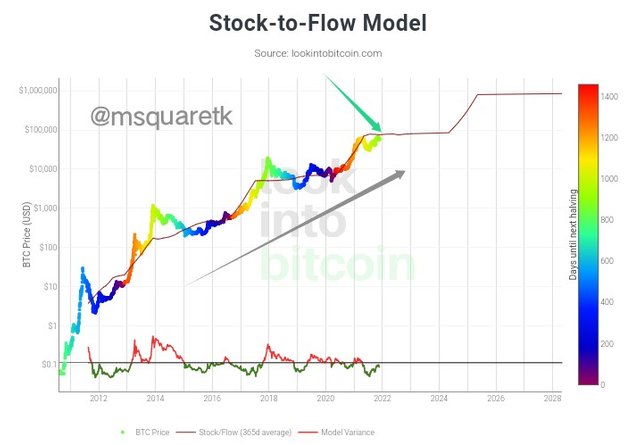
Stock to flow Model Indicator Source
The formula for calculating the stock to flow model is:
SF = Stock / Flow
Stock = Quantity in existence or reserved
Flow = Annual flow production
Annual Flow = Reward / block × annual block production
As at today, the current reward = 6.25 BTC
To calculate annual block production of bitcoin.
1 block formed at every 10mimutes
6 blocks formed at 1hr
144 blocks is formed daily
52,560 blocks is formed yearly.
Therefore, annual block production = 52, 560 blocks
So, annual flow = reward / block × annual block production
= 6.25 ×52, 560
= 328,500 BTC
Hence, annual flow = 328, 500 BTC
As at the time of performing this task, the stock in existence is 18,883,012 BTC. See the screenshot below
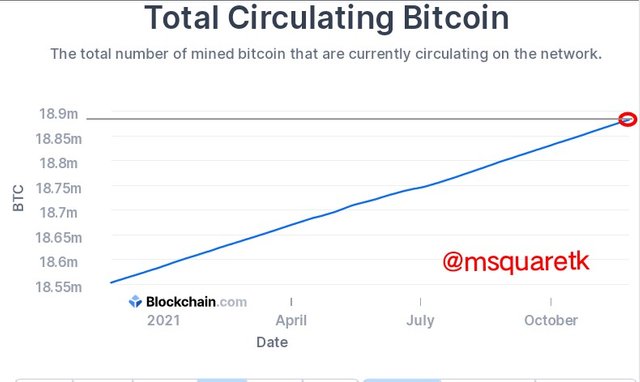
Bitcoin in circulation or existence Source
Annual flow = 328, 500 BTC
Stock (in existence) = 18, 883, 012 BTC
SF = stock/flow
= 18, 883, 012 / 328, 500
= 57.5
Now to calculate the value of stock flow model, we used this formula:
Stock to flow model = 0.4 ×(SF )^ 3.
= 0.4 × (57.5)^3
= 0.4 × 188132.517
= $75, 753.0068
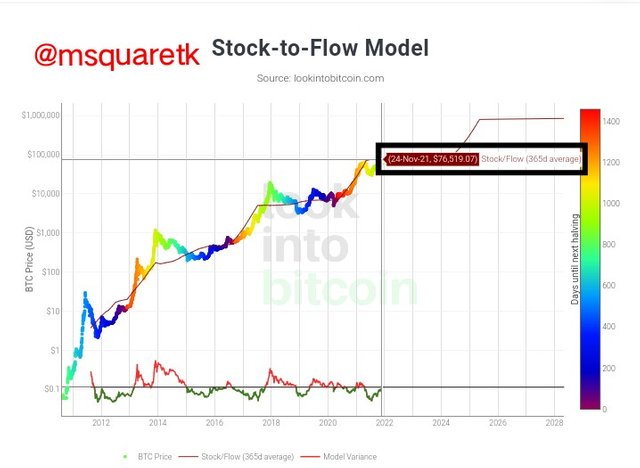
Stock to Flow ModelSource
Explain what should happen in the next Halving with the Stock to Flow. Calculate the Stock to flow model for that date, taking into account that the miners' reward is reduced by half
The next halving I'd expected to occur in the year 2024. This time, the stock data will increase as more bitcoin will be issued to circulation. 656,250 BTC will be added to the amount of bitcoin in circulation. And also the reward will be halved, which will be 3.125 BTC. Hence,if we are to calculate the stock to flow model, we are going to use new data.
Let's see the calculation now.
SF =Stock / Flow
Stock = Amount in circulation + amount that will be added in 2024
= 18,883,012 + 656, 250 = 19, 539, 262 BTC
Flow = new reward × annual block Production
= 3.125 × 52,560
=164, 250
SF=19, 539, 262 / 164, 250
= 118.96
Now, having found the value of SF, we can now calculate the value of stock to flow model.
Stock to flow model = 0.4 ×(SF )^ 3.
= 0.4 × (118.96)^3
= 0.4 × 1683460.25
= $ 673384.10
Therefore the stock to flow model will be $673,384.10
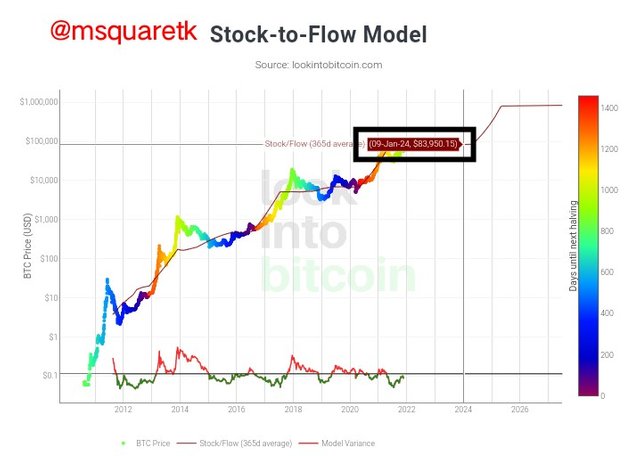
Stock to Flow Model in the year 2024 Source
Looking at that graph above, we can see that the stock to flow model would increase in the next halving. Thanks Stock to flow model now is about $ 75, 753.00 I the next halving, it would be about $673,384.10. This is a very great increase. That's how it would continue to be.

Conclusion

Metrics indicators are one of the important technical tools which can help investors analysis the direction/movement of price. Puell multiple Indicator is a great Indicator which is used to measure or estimate the mining pool in comparison with the 365 days moving average.
Another important Indicator is hash rate which is used to measure the computational computing power consumed by miners during the process of validating the transaction. The last Indicator discussed in the task is stock to flow model. It's also a great metric indicator which measures how scarce or abundant a commodity is.
Halving is an event which is used to control the circulating supply of an asset. Halving is the process by which block reward is cut into half. Bitcoin halving takes place at every 210, 000 blocks and it takes four years before it will form because a block forms every 10minutes.
Thanks to Professor @pelon53 for bringing this course up. I have learnt one or two things from the course. I look forward to seeing more from you.

CC : @pelon53
Written by @msquaretk