Crypto Academy / Season 3 / Week 2 - Homework Post for professor @cryptokraze by @Monz122
Hello everyone this is Monz from India and I am here with homework season 3 week 2 given by @cryptokraze.
From each new homework I am trying to learn the way of presentation of the cryptoacademy's homework.
Now let's begin with our today's homework
Market Structure
Market structure can be defined as price movements in the market which gives an idea of the high trends or low trends of the market which provides the traders to act according to the requirements of the market scenario.
They act as the basic supporter and resistance on the market charts.
Moreover market structures are trend following basic tools by reading which one can make out the movement of the assets in the market.
Market Structures are of three types which are:
• Bull trend
•Bear trend
•sideways trend
Most of the times the market trends in sideways direction...
Market Structure are reffered as Price Action and helps in giving the reflection of how the market moves.
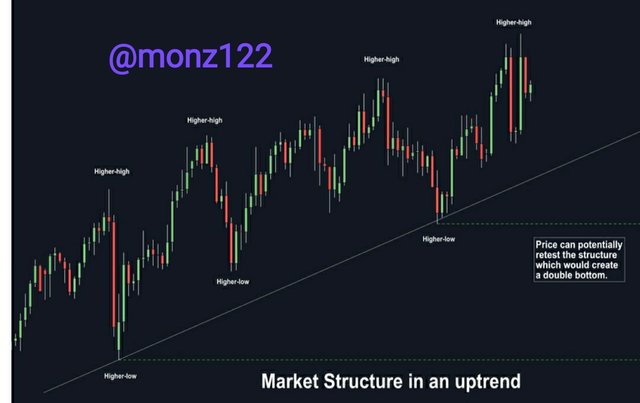
Uptrend Market Structure
Upward Market structure is a situation where the price movements of the market is in upward direction.In upward trends of the market the sequence of the movement follows a higher trend compared to the successive peaks or the earlier ones.

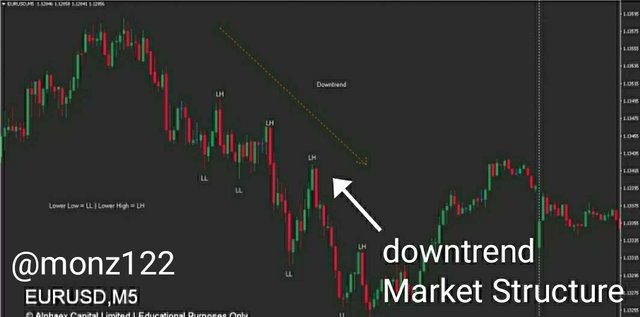
Downtrend Market Structure
The opposite of upward trends structure remains in case of downwards market structure in this structure the movements of the price is in the downward directions...
This type of structure is characterized by lower peaks moreover, technical analysts give attention to downward trends as they signifies something much more than losing streak.
Sideways Market Structure
Sideways market structure can be defined as a situation where the price of the security can be traded within stable range or defined range of price .
Sideways markets can be described by regions of price support resistance within which the price revolves .
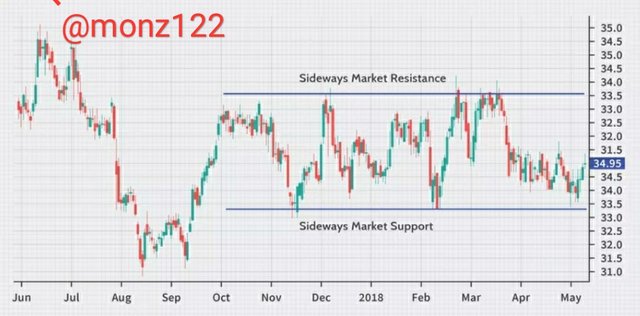
According to me these type of markets are a bit tricky
and sometimes seems tougher for new people like us..
Concept of Highs and Lows
The market structure is created by the movement of price which provides us the clear information of the market's direction which helps the traders to act according .
In an uptrend market the direction of the market is generally higher highs and higher lows and the exact opposite situation takes place in down trends which is the direction of the market is generally lower lows and lower highs.
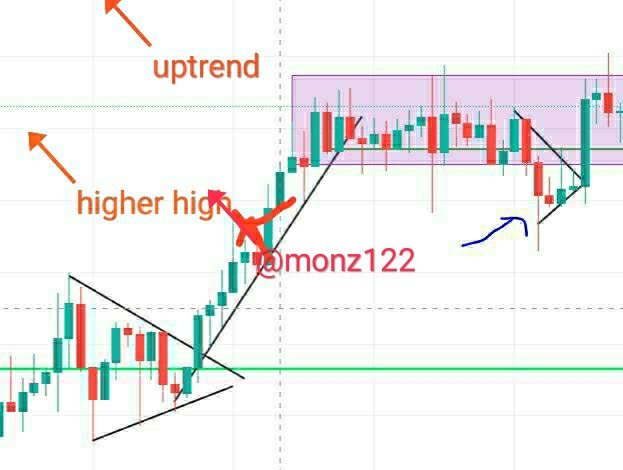
Giving the further explanation in the chart below
Higher highs
Higher high indicates an uptrend which is occurring with the Increasing price then the previous high and this shows that the market is in an upward movement. With the help of this the traders further decides the action to take regarding their assets after doing analysis of the chart .
Moreover in higher high the point which should by noted by we traders are that the new high must be higher then the previous highest point then only the current high point will be the highest point.
Higher Lows
Higher lows in simple words means an uptrend type of market which is formed at low points of an uptrend market which creates low points.
In higher lows the price remains above the previous lows compared to the last trade.
Moreover higher lows indicates starting of an uptrend forms at the bottom of downtrend.
It causes a shift in the market sentiment in the chart of that asset.
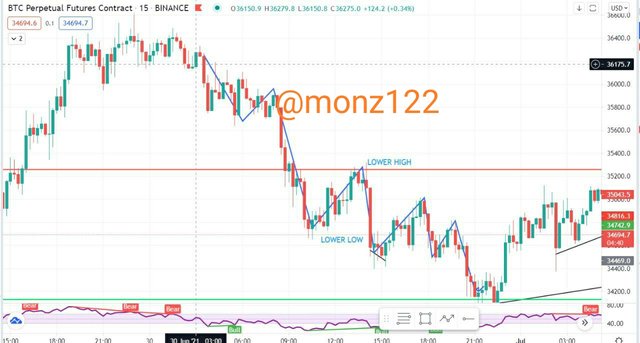
Lower Highs
Higher lows is an uptrend trend in market where the peak can be seen in the descending trend in the chart
which means the prices which were higher has now decreased which shows the lower highs of the given asset on the chart during this period.
It is a situation where the the current high is lower then the previous high which indicates a downtrend
causing a shift in market sentiments.
Lower Lows
As from the name itself we can understand that lower lows are market situations where the new low is lower then the previous low.
Here the point to understand is the structure caused on the chart is downward swing of the price movement which creates a downward trend which can be called lower low point of the asset.
Trend Reversal using MSB
Trend reversal is a situation where but direction of the asset changes and movesin the opposite direction, or you can say Shift in the sentiment from buyers to sellers etc.
Moreover early reversal Trend can be characterized generally by the formation of a lower low and lower high in the chart at the top of an uptrend, in a downtrend the formation of a higher low and higher high at downtrend in the bottom ...
For uptrend
For market structure break generally we have to look for 3 conditions which are
• looking for lower high in an uptrend
• marking out a neckline
• waiting for clear break of the neckline.
Identifying a reversal earlier in a Downtrend
For identifying the reversal in a downtrend
One has to look for , formation of a higher low at the bottom of a downtrend.
Taking an example of BTC/USD on a chart I will be for example say sporting out a lower high price of $34.50 I would have to mark a neckline say $42.5
Then I will have to wait for a clear breakout of the neckline .
Explain Trade Entry and Exit Criteria on any crypto asset.
It is very important for a trader have a good strategy of fair and clear trade entry and exit.
These are the important part of a trade professionals
so we must look at all the points carefully regarding entry and exit.
Buy trade Entry
For a buy trade entry the market has to be in a downtrend as we have to look for a higher low at bottom of downtrend.
•Moreover for a buy entry there has be a higher lows following after lower lows.
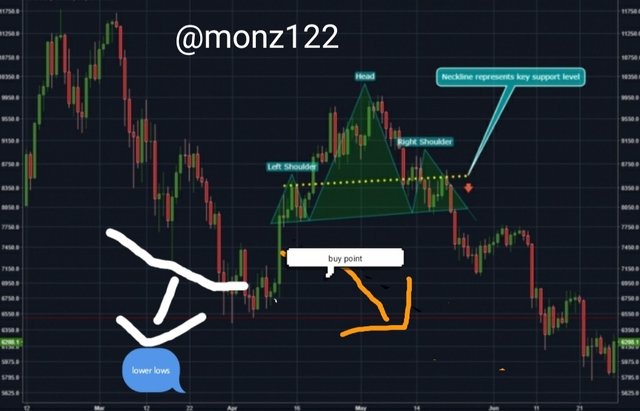
•We will then have to identify a neckline and then take the initiative of buy trend as the bullish candle breaks the neckline.
Sell trade Entry
For sell trade entry we have to keep the following points in mind which are:
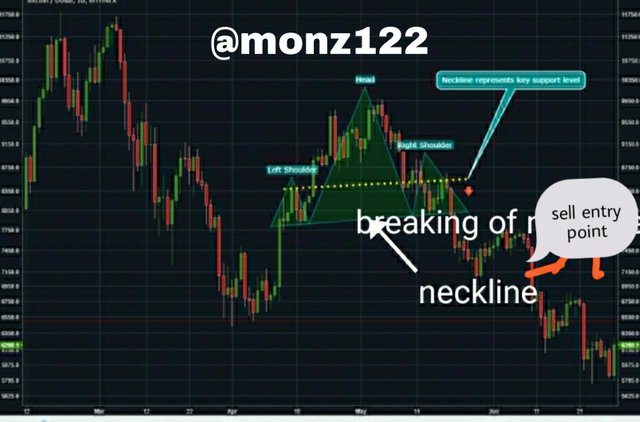
Market should be in uptrend
After higher highs there should be a lower high, then neckline should be identified and as the neckline candle breaks sell position must be initiated.
Exit Criteria
In simple words according to our risk capacity be it 1:1 or 1:2 which means profit booking level being twice or in the same ratio .
Stop Loss is necessary for every trade and hence is the exit Criteria.
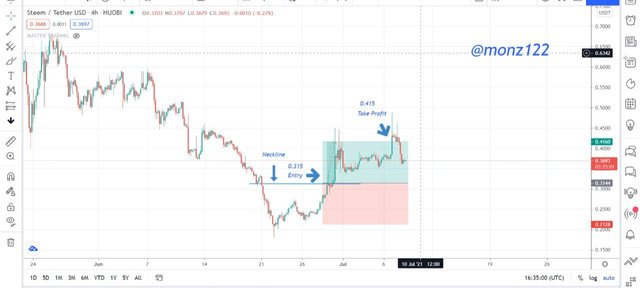
As you can clearly see my trade details
My buy price = 0.315 USDT
Take profit = 0.415 USDT
Conclusion
From this lesson I came to know more about technical analysis of market structure break (MSB)
Off trend reversal strategy moreover I tried and gave my best and showed the above trade where I book a profit and achieve my target.
Now in short I would like to thank our professor @cryptocraze for giving us this homework with the help of which I came to know more about the market strategy of the cryptocurrency markets.