Crypto Academy / S4W2 - Homework Post for [@kouba01] / Crypto Trading With Williams %R Indicator | How to filter false signals from W%R?
Greetings everyone I hope you will be well and enjoying good health by the grace of Almighty Allah who is most merciful and gracious to everyone. Today I am here to provide my assignment given by the professor as I have attended the lecture of professor @kouba01 about a trading indicator that is Williams % R, and I have learned really a new strategy to manage my trades.

1. Explain the Williams %R indicator by introducing how it is calculated, how it works? And what is the best setting? With justification for your choice.
Nowadays everyone is trying for the trading and eventually using different strategies to become a successful trader, they are using different indicators to guess the correct moves of the market. Similarly, Williams %R is also a trading indicator that is an indicator of momentum and tells the next speed and movement of the market.
Williams %R is also known as the Williams Percentage Range. Being a momentum indicator it moves between two specific values which are 0 to -100. Williams %R is used to measure the Overbought and Oversold of the market. And after understanding these oversold and overbought points we can also use this indicator to find the entry and exit points of the market.
This indicator was developed by the Larry Williams as he faced problems in understanding the overbought and oversold points in the market. In order to overcome these issues, he developed his own indicator which compares the stock closing price to the high low range over a specific time period specifically 14 days or periods.

Formula:
Williams %R is the ratio of the (Highest High - Close) to (Highest High - Lowest price in the specified period)
Williams %R = (Highest High - Close)/(Highest High - Lowest low)
Here:
- Highest High is the highest price in the period that is typically taken as 14 days.
- Close is the most recent closing price at the time of the calculation.
- Lowest Low: is the all-time low price in that specific time period for example in 14 days.
How to calculate?
It is very simple to calculate Williams %R and we need only a few quantities to apply the formula and to calculate Williams %R.
- Firstly it is calculated in a specific time period that is specifically 14 days. It means one period consists of 14 days.
- We have to notice all-time highs and all-time lows within the period as it is required for the calculation.
- Then we have to calculate and notice the current price, highest price as well as lowest price within the 14 days(period).
- Now we have to put all the known values in the formula and we will get Williams %R.
Example
If we take a specific time period as 14 days. And the observed highest price is $50 and the closing price is $45. And the minimum price is $30. Then the Williams %R can be calculated as follows:
Williams %R = (50 - 45) / (50 - 30) × -100

Williams %R = (5 / 20) × -100

Williams %R = 0.25 × -100

Williams %R = -25%
How it works?
It is a momentum indicator and tells us the speed at which the price is moving. And by the measurement and understanding of this movement, we can easily find accumulation areas from where the reversal trend may start.
These accumulation areas are overbought and oversold areas. These accumulation areas are determined by the output of the Williams %R. As we have fixed two values that are -20 and -80. If we obtain the values between 0 to -20 then it is an overbought signal and now the reversal trend will start.
But on the other hand, if we get any value between -80 to -100 then it is an oversold signal and from here the reversal trend will start.
How to apply and the best setting for W%R
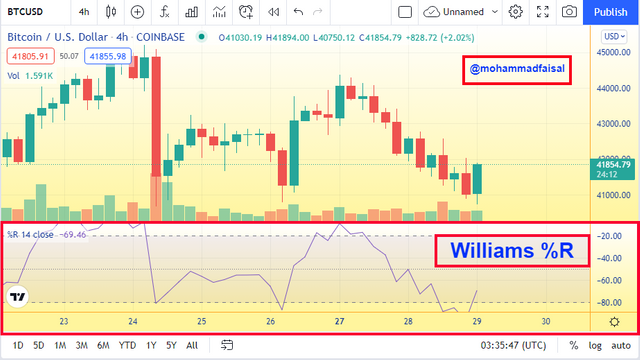
Tradingview is an amazing platform and we can also use its features free of cost. And in order to apply this indicator, we have a free account in tradingview then we can implement this indicator.
- Firstly we have to run any chart of any cryptocurrency then we have to select
fx.

- There we have to search
Williamsin the search bar. - Then choose
Williams %Rand now this indicator has been applied to the chart.
Best setting:
As I am a beginner in trading and it is the first time for me to use this indicator so I will use the default settings provided. It is the best setting as it has been obtained by thousands of experiments by the creator who is also a great trader and well-known in the world of trading.
But one can change the number of periods according to the trade category if someone wants to make a short-term trade then he can use short periods and if one wants to make a long-term trade then he has to adjust long periods in the indicator by accessing it from the setting.
The most important thing is that everyone has his own choice and trading style so it can be adjusted perfectly after doing a lot of experiments, and we can do experiments using this indicator at the demo account and then we can easily make a decision.
2. How do you interpret overbought and oversold signals with The Williams %R when trading cryptocurrencies? (screenshot required)
Williams %R is an indicator that is also known as an oscillator as its values change from 0 to -100. And the graph of the indicator commonly shows two lines at -20 and -80. These both points are the peak values that decide the next movement of the price in the market.
Overbought
If the graph of the indicator gives us the value between 0 and -20 then it is an overbought signal but we should wait for a while and should give some time to the market to get an authentic signal. And if you start selling after seeing the overbought signal then you may fail in predicting the price so we have to wait so that the market adopt its way.
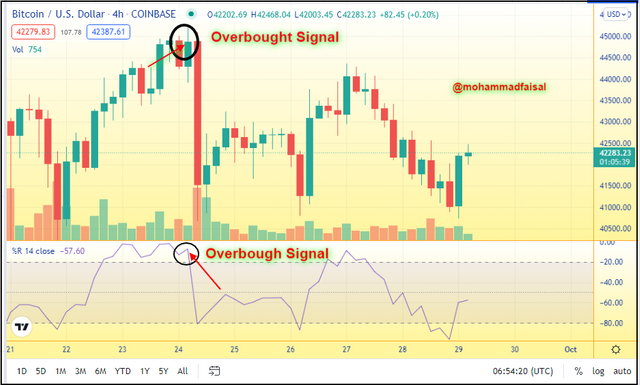
Here I have applied the Williams %R indicator to the BTCUSD chart and I have gotten an overbought signal as the value of the W%R is between 0 to -20. And this signal worked correctly as you can see that after this overbought signal the price moves downward and the reversal trend was followed. In this way, we can detect the overbought signal and can follow a new strategy for trading.
Oversold
But on the other hand, if the graph of the indicator indicates the value of the W%R between -80 to -100 then we can understand that it is now an oversold signal. So now we should wait a little bit for careful trading and give some space so that the price moves and follow the next trend.
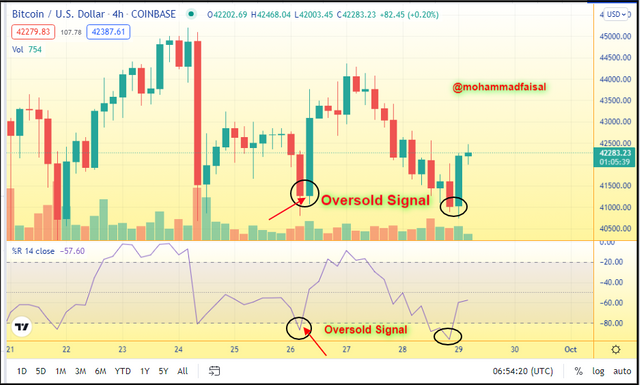
Here you can see that I have applied the Williams %R indicator to the BTCUSD chart and I have gotten an oversold signal as the value of the W%R is between -80 to -100. And this signal worked well as we can see that after this oversold gesture the price moves upward and the reversal trend was followed. In this way, we can detect the oversold signal and can follow a new strategy for trading.
3. What are "failure swings" and how do you define it using The Williams %R? (screenshot required)
A failure swing occurs if the line of the indicator does not rise above the reference line which has taken at -20. It also happens whenever the lines do not cross the bottom reference line which we have taken at -80.
If the indicator is unable to cross the upper referenced line then it points out the weakness of the upside and now it will indicate the sell signal and the market will move downward. And similarly on the other hand if the indicator does not cross the bottom referenced line and turns around before crossing that line then it shows the weakness on the downside and now it will give us the buy signal and the price will move upward.
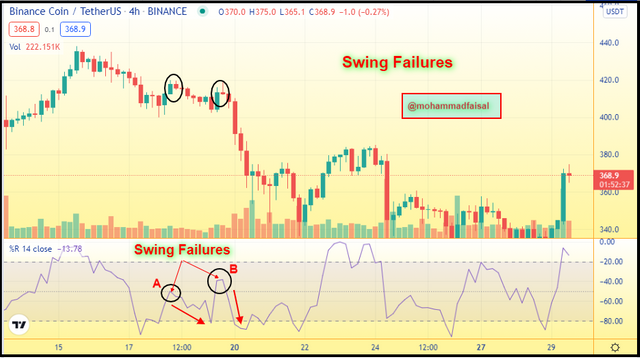
Here in this picture, I have spotted two failure swings which I have denoted by A and B. At point A you can see that the indicator line does not cross the above line nor even touch (-20) and at that point, it gave an upside weaken the signal and the market moves downward. So it is a failure swing.
Similarly, at point B the market behaved like the first Failure Swing and again gave an upside weaken the signal and the price moved downward following an unexpected trend.
4. How to use bearish and bullish divergence with the Williams %R indicator? What are its main conclusions? (screenshot required)
Williams %R indicator is an interesting and informative indicator that also tells about the bearish as well as about the bullish divergences. By using this indicator and after careful research we can easily get benefit from the opportunity and make trade accordingly and can save as well as increase our portfolio.
A bearish divergence occurs when the indicator adopts a downtrend while the remaining market follows an uptrend and the prices rise continuously. We know that when the buyers are weak then the prices fall. And in this divergence, the buyers are proved to weaken, and eventually the price fall and it is a bearish divergence.
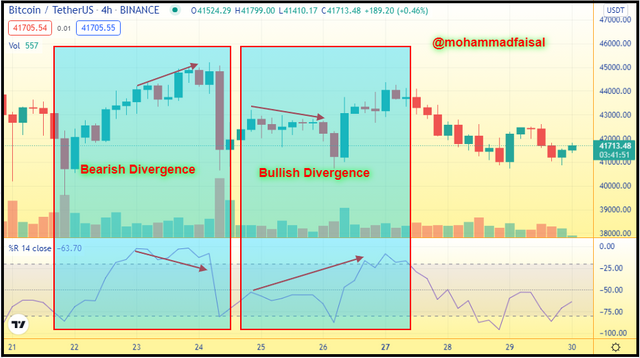
A bullish divergence occurs when the indicator adopts an uptrend while the remaining market prices follow a downtrend the prices of the assets fall continuously. At that point the indicator indicates the weak side of the sellers and due to which the price rise of that specific asset, this is the Williams %R bullish divergence.
So we can say that Williams %R is an amazing and important as well as interesting indicator through which we can understand the next movement of the market prices by understanding the weakness in the current trend. And with the help of this, we can understand and look over to open a long trade or a short term trade.
5. How do you spot a trend using Williams %R? How are false signals filtered? (screenshot required)
Williams %R indicator as an oscillator has been proved a good indicator to spot the next market movement and trend. We can easily spot the next market price trend using W%R as it is easy and there is no trick and difficulty to understand it.
To spot the next market trend we make a standard and take a standard value and then we compare the other values with that standard value and get results and then we decide accordingly.
Here in the Williams %R, we take -50 as a standard value, and then we compare other values with this -50 and guess the next movement of the market.
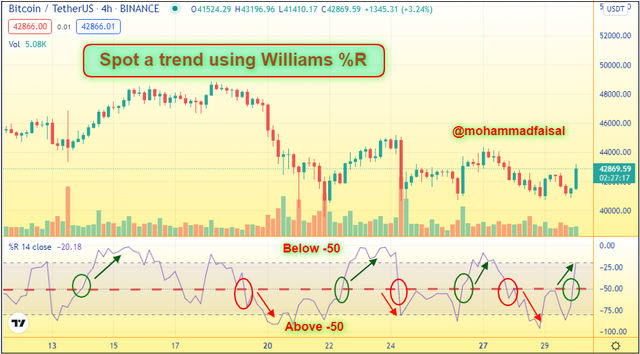
Here I have used the BTCUSDT chart to explain how can we determine the next market movement with the help of the W%R. So in the above-captured picture of the BTCUSDT chart I have highlighted the standard value that is -50- with the help of the red dashed line.
- Red Ellipse: Red ellipse is indicating the reading above the -50 and then it has been used that market now will go down following a downtrend.
- Green Ellipse: Green ellipse is indicating the reading below -50 and then it has been used that market now will go upward following an uptrend.
We can observe that all the time whenever the indicator has given us a reading below -50 then from that point the market price has gone upward following the uptrend, indicated on the chart with green ellipses.
Similarly, we can see that whenever the indicator has given a reading above the -50 then the price has gone downward following a downtrend, indicated on the chart with the red ellipses.
Filtration of False Signals
It is a well-known fact that everything is not perfect. Everything has its own useful benefits as well as some dark aspects. Similarly, Williams %R has its dark side that sometimes it may fail in providing correct signals so in order to filter the false signals we have to use another indicator.
Mostly MA(Moving Average) indicator is used along with the Williams %R indicator to filter the signals. So let's see how it works combining both these indicators. I am going to use the BNBUSDT chart and applying both of these indicators.
Here the MA indicator will act as a filter. The Williams %R signals will be used along with the trend of the MA indicator. We have to focus on the movement of the Moving Average indicator and after following its trend we can get correct signals.
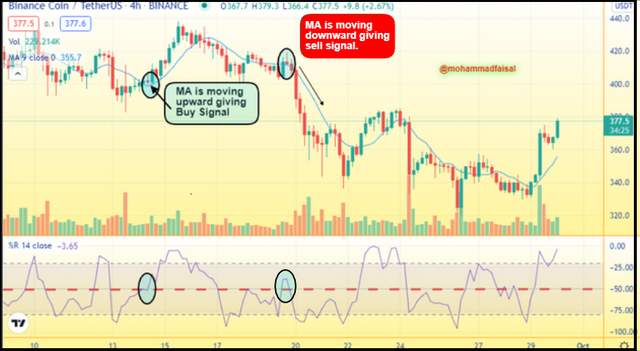
We have to concentrate on the Moving Average indicator as to if it moves upside and grows then it gives a buy signal. And similarly, we can see that the Williams %R is also above -50 which is also giving the buy signal.
And when the Average Moving indicator is going down then it gives us a sell signal. Here in the chart the second ellipse marked on the Williams %R indicator crossed -50 and gave a buy signal but Moving Average gave us a sell signal as it was moving down and it was a correct signal. And the price went down and it followed the Moving Average indication.
Here Williams %R gave a false signal which was filtered out with the help of the Moving Average. In this way, we can filter false signals.
Q6. Use the chart of any pair (eg STEEM/USDT) to present the various signals from the Williams %R indicator. (Screen capture required)
We can get good signals of buy and sell with the help of the Williams %R and I want to tell you that it works. We know that whenever the indicator gives us the reading below -20 then we get a sell signal as it is overbought condition. Similarly, when the indicator gives us the value above the -80 then it is a buy signal as this is the oversold condition, and next the market will move upward.
Buy Trade BNBUSDT
Here I used the Williams %R indicator and detected a buy signal of BNB. I am talking about yesterday when I used this indicator and had a great buy signal. You can see that the indicator gave a value above -80 and it was indicating a strong buy signal. So I made an entry and bought a BNB and now I am very much happy as it worked perfectly and now I am in profit.
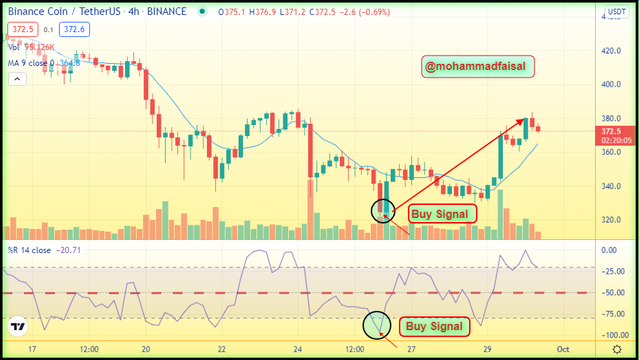
So as I have detected a buy signal using Williams %R you can also detect that signal and can make a profit.
I also want to mention something here that we don't have to make an entry atone we have to wait a little bit so that the market set its next trend. As I also did the same I waited some time for the market to know about the next trend.
Sell Trade BNBUSDT
We know that when the Williams %R indicator gives us an output value below -20 then this is an overbought condition and after this condition, the price will move downward and it is a sell signal. As you can see in below chart that I have detected a sell signal in the BNBUSDT and I am now thinking to take an entry in the sell trade.
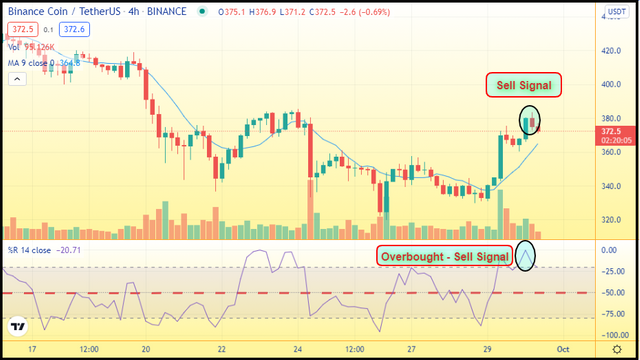
We can see that the indicator is giving us a value below -20 and it is a sell signal as the market showing an overbought signal. But before taking an entry we have to wait a little bit more to understand the next movement as I am also still waiting for the movement and watching it again and again.
Conclusion
Nowadays trading has become very common and everyone is investing the crypto trading and they are using different sources to get signals and using different indicators. And Willimas %R is the best oscillating indicator which tells us about the speed and the next movement of the price.
By using the Williams %R indicator we can know the overbought point as well as oversold points and then make an entry accordingly. It is very simple and easy to use. We know that the indicator moves between two points from 0 to -100.
If the indicator gives a value below -20 then it is overbought condition and now it is a sell signal and we can sell after waiting a little bit and seeing the movement in the price. And if the indicator gives us a value above -80 then it is an oversold condition and now it is a buy signal. So we can easily detect sell and buy signals using Williams %R.
But sometimes Williams %R fails in providing the correct signal then at that point we have to filter false signals using a combination of any other indicator along with the Williams %R. Mostly the Average Moving Indicator is used to detect and filter false signals.
But I want to tell you that I have used recently this Williams %R indicator and I had a great entry and I am in profit right now.
Hi @mohammadfaisal
Thanks for participating in the Steemit Crypto Academy
Feedback
This is good work. Thanks for taking the time in demonstrating such a clear understanding of trading with the William %R indicator.
Total| 9/10
Thank you, professor.