Trading with Accumulation / Distribution (A/D) Indicator - Crypto Academy / S4W5 - Homework Post for @allbert.
I am glad to attempt the assessment task of week 5 of cryptoacademy season 4. Here below I present my home work task.
Q1
Explain in your own words what the A/D Indicator is and how and why it relates to volume. (Screenshots needed).

WHAT IS A/D INDICATOR.
The word A/D stands for accumulation and distribution. The A/D indicator is a simple tool for measuring the money inflow and outflow of an asset. The indicator measures the relationship between the price and the volume of an asset to determine if it is being accumulated or distributed.
Accumulation refers to when people are acquiring the asset whereas distributions refers to when people are selling off the asset.
High volume inflow causes price to rise, high volume outflow causes price to drop. Ad indicator weighs the volume and the price to determine if the asset is being accumulated or distributed.
The indicator is built on the premise that volume precedes price. The relationship between volume and price are obvious. When there are high volume inflow of an asset, it results to a rise in price. The movement can be understood as an accumulation period (uptrend)establishing that there are more buyers in the market than sellers. The opposite is true with regards to the distribution (downtrend). The high volume of sellers causes the price to go down and the AD indicator will move downward. Ad indicator helps traders understand the trend of an asset.
The indicator is a straight forward indicator used for price confirmation. It helps traders understand the price movement of the asset and therefore helping shape their decision of entry.
HOW IT WORKS.
When the trend of an asset is an uptrend the indicator rises upward. Conversely when downtrend is the case, the indicator slopes downward.
Such agreement between the asset price and the indicator points out that the trend may continue for a while and good signal to trend along with the trend.
Divergence of the indicator is equally a good signal.
When the price chart keeps going up and the indicator is moving downwards, there is a negative divergence and this signals that possibly reversal could be imminent to the bearish.
When the price asset chart keeps moving downwards while the indicator is making an upward movement, it is a positive divergence and this signals possible bullish reversal.

Q2
Through some platforms, show the process of how to place the A/D Indicator (Screenshots needed).
PLACING A/D INDICATOR TO A CHART
In this exercise I will use investing.com.
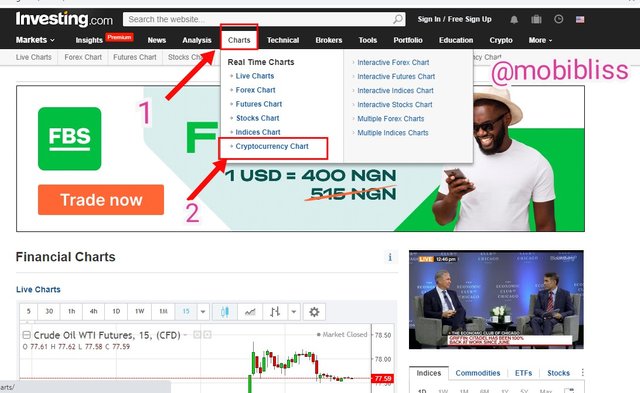
Goto investing.com website, locate charts
as shown in fig 1. Because our focus is on cryptocurrency, select cryptocurrency. You can choose any crypto pair of choice. The chart I chose is for sample purposes.
Fig 1.
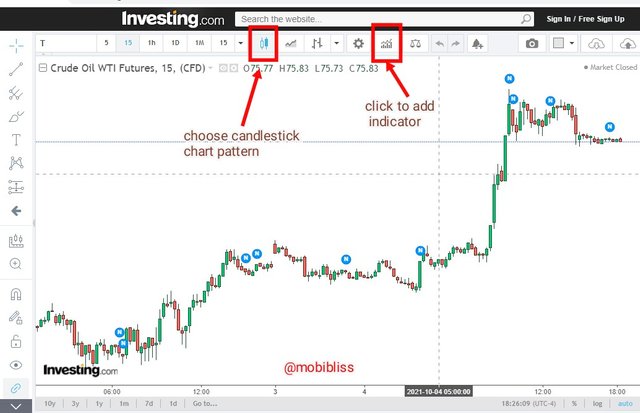
Choose candlestick chart pattern as shown on fig 2. Then click on the indicator icon to select indicators.
Fig 2.
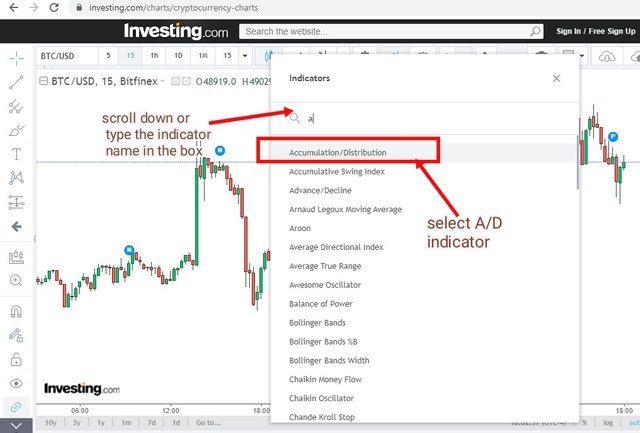
On the next window, scroll to select A/D indicator or type in the box as shown on fig 3.
Fig 3.
Now we have our indicator placed on a chart.
Fig 4.
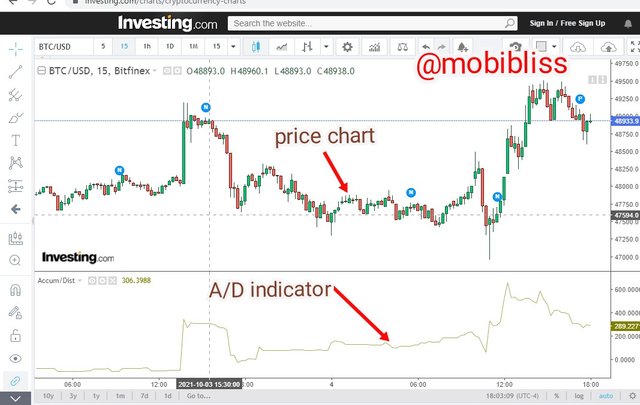
BTCUSD chart. A/D indicator, investing.com
•••

Q3
Explain through an example the formula of the A/D Indicator. (Originality will be taken into account).
A/D indicator calculation.
To calculate the accumulation/distribution
indicator , we need to calculate the components. There are three main components to which forms the formula.
The MFM (money flow multiplier)
The MFV (money flow volume)
The A/D line (accumulation/distribution line)
Calculating the money flow multiplier (MFM)
First we subtract the period low price from from the closing price. Next, we subtract the closing price from the high price. Next we subtract the result of the later from the result of the first. Next we divide the total result with the result of the low price subtracted from the high.
Simplification
MFM formula = ( period close price - low price) - (high price - closing price) divided by (high price -low price)
Calculating the money flow volume (MFV)
MFV formula = ( MFM × periods volume)
Calculating the A/D line
A/D line = previous AD + Current MFV.
The money flow multiplier (MFM) ranges from +1 (positive multiplier) to -1 (negative multiplier) depending on the closing price of the asset for the period. To get a positive MFM the closing price need to be in the upper half between the the high of the period and the low of the period. To get a negative MFM the closing price would have to be within the lower half between the periods high and the periods low.
When there is a positive MFM it means that the buyers of the asset are winning over the sellers and the price of the asset should move up. The opposite happens in the negative MFM.
A/D INDICATOR CALCULATION EXAMPLE.
Let's have an example using the formula above.
Let's take a crypto to which we want use in the sample to be "crypto x". Let's assume the below values.
[Crypto x] Close Price = $148
[Crypto x] Low Price = $145
[Crypto x] High Price = $150
Current Period money volume = 9,500
Previous Period AD = 100,000
Using the above formula format. We follow the sequence.
1• First we get the [crypto x] MFM
MFM = ((Close Price – Low Price) – (High Price – Close Price)) / (High Price – Low Price)
Therefore MFM = ((148 – 145) – (150– 148) / (150 – 145)
= (3) - (2)/ (5)
MFM = 3-2 ÷ 5 = 0.2
MFM = 0.2
2• Next we will get our money flow volume (MFV)
MFV = ( MFM x Volume for the Period)
Volume for the period = 9,500
MFV = 0.2 x 9,500 = 1,900
Money Flow Volume = 1,900
3• Next we get the A/D
AD = (Previous Period AD + Current MFV)
Previous = 100,000
Current MFV = 1,900
AD = 100,000 + 1,900
[Crypto x ] A/D indicator = 101,900

Q4
How is it possible to detect and confirm a trend through the A/D indicator? (Screenshots needed)
Trend refers to the movement direction of an asset price. It can be up or down.
An uptrend is often marked by more green candles lined upward. Using heikin ashi candles it is easier to spot out due to the smoothed nature of the price chart pattern.
When A/D indicator line points upward, in agreement with the price chart it confirms the uptrend.
On the other hand, downtrend ( bearish trend) is often seen as a lined up red candles pointing downward. When A/D indicator line points downward, it confirms the downtrend.
On the image below, the areas marked lettered A-D has a corresponding A/D indicator confirmation.
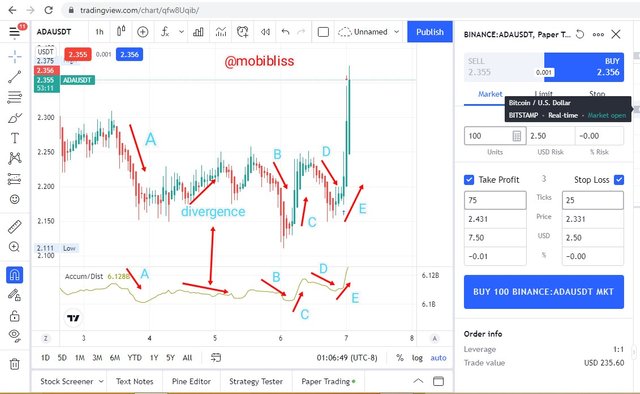
A/D indicator. adausdt. Tradingview.com.

Q5
Through a DEMO account, perform one trading operation (BUY or SELL) using the A/D Indicator only. (Screenshots needed).
In this exercise, I will first of all show a successful trade using this indicator strategy.
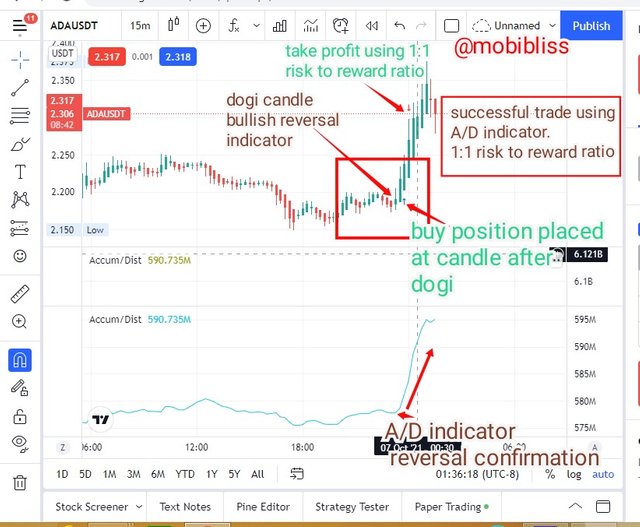
adausdt tradingview.com.
A/D offers stronger signal when divergence occurs. A bullish divergence points to a bullish reversal. A bearish divergence points to a bearish reversal.
Other signals as I used above serves as a confirmation tool.
I am demonstrating trading reversal using A/D indicator.
To trade reversal, we need to be sure that the reversal has happened and we can confirm it using A/D indicator.
Using heikin ashi, it is easy to spot reversal. Price pause or reverse after dogi candles.
Using A/D, volume precedes price. So to spot bullish reversal means that the volume of buyers should increase over sellers and this will cause the A/D line to point upwards. It give a trader stronger confidence over the spotted reversal. Same is true for bearish reversal, S line should point downwards.
Let's see what I mean.
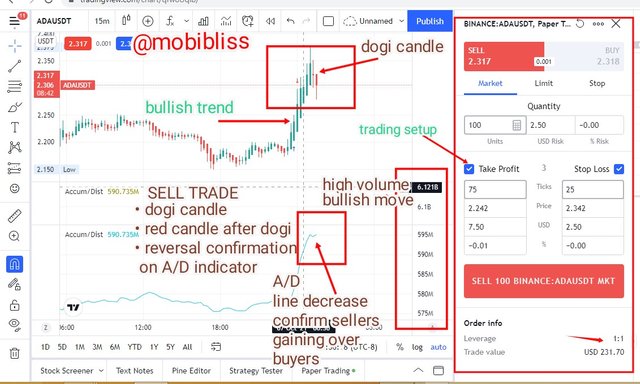
Adausdt. Tradingview.com.
In the image above I spotted the dogi. I allowed a red candle to appear and close confirming that the reversal has happened. My A/D indicator shows reversal as it now points downward.
I used 1:1 risk to reward ratio. As seen in the setup.
You can see the stop loss and take profit levels in the setup areas.
The next image is the application of what I did in the above image.
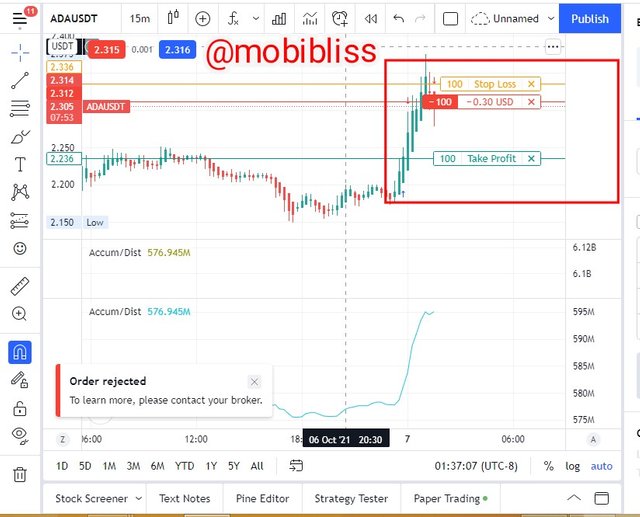
Adausdt tradingview.com.

Q6
What other indicator can be used in conjunction with the A/D Indicator. Justify, explain and test. (Screenshots needed).
There are lots of indicators that can be used in conjunction with the A/D indicator. Indicators like the alligator, Bollinger bands, parabolic sar etc. I have chosen moving average for this task.
EMA cross and A/D indicator.
If we are familiar with Exponential moving average (EMA), or simple moving average ( SMA) we understand that there are ways to use it to spot entry positions for buy or sell.
This process involves adding two moving averages, a faster period and a slower period. When the faster period cross the slower from bottom to top it signifies a buy signal. When the faster period cross the slower from top to bottom, it indicates a sell signal.
In this case I added the periods of 9 and 21. The green line in the below image is the 9 EMA and the red line is the 21 EMA.
In the below image, when ema sends a signal, A/D can help to confirm it.
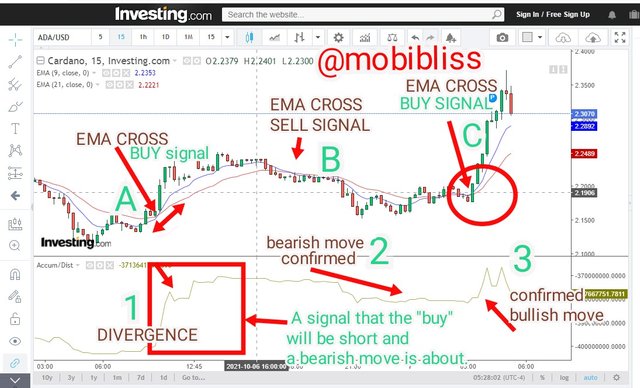
Adausd investing.com.
The area marked A and 1, we saw an EMA cross at point A . The green line crossing from bottom to top indicating a bullish movement, but. A/D divergence at point 1 shows that the bullish signal might not be for long.
Point B and shows sell signal and correspondingly confirmed buy the A/D at point 2.
Point C is a sell signal. Point 3 confirms it.

CONCLUSION.
A/D is a simple tool but in application it is very useful to spot trend and confirm signals sent by other indicators. Using A/D in conjunction with other indicators works better.

Thank you @allbert.
Image sources.
Investing.com
Tradingview.com
Hello @mobibliss Thank you for participating in Steemit Crypto Academy season 4 week 5.
Thank you @professor @allbert. Thank you for the corrections, will work on them.I sincerely appreciate.
As a student, I wanted to explore my personal experience testing the indicator. The method I applied was in combination with my little knowledge about trading.
On question 5 I used demo account, I considered that there are various ways to use the indicator. I simply applied the method that works for me during my testing of the indicator.
I first explained what I was about to do before placing the trade. I showed a successful trade in the first image of question 5 using my strategy, then explained the steps I was about to take on the second image and placed an actual trade on image 3.
On question six, the strategy I presented works for me, here A/D is used as a confirmation tool. I use this strategy in option trades and it is superb.
I know you emphasized on uniqueness. So I had to use what works for me in order to make a unique presentation.
Thank you once again professor @allbert.