Crypto Academy /Season 3/ Week 3 - Homework Post for @lenonmc21
DEFINE IN YOUR OWN WORDS WHAT IS A TREND AND TREND LINES AND WHAT IS THEIR ROLE IN CHARTS?
TREND
A trend can be said to be recognized movement that exists at a stated time. Now when applied to charts, a trend can be said to be the common recognized direction of movement in the prices of assets. The direction of movement could go upwards or it could go downwards. Of course the direction of movement is dependent on where majority of investors are moving the price to. This also means that investors are investing their capital in the same path.
Depending on the direction of movement, you could have a bullish or bearish trend. An upward movement is termed a bullish trend or uptrend while a downward movement is called a bearish trend or downtrend.
TREND LINES
A trend line is a line that is drawn on a chart which helps to find out more clearly how strong a trend is. It helps traders to find the direction of the trend. The line usually connect the swing highs or the swing lows to show the prevailing direction of price. The major importance of trend lines is that it helps to keep track of the movement direction of price. This equips traders to make good decisions regarding their investments. For you to form a valid trend line, you need up to three swing highs or three swing lows to draw a trend line in either direction.
THE ROLE Of TRENDS AND TREND LINES IN CHARTS
Trends helps traders to be fully informed regarding the price of an asset and the movement of its price since it shows the direction of common interest of the market traders.
The presence of bullish and bearish trends are essential data seen on the charts, and this helps to make future price prediction and analyze the risks inherent in investing in any particular asset.
Trend lines is a technical analysis tool that is used to verify the direction of movement of price of an asset which equips traders to make good decisions in their trading investment.
Trend lines also helps to predict future movement of price of an asset since it can show when there is a bullish or bearish trend or maybe when there is no trend.
EXPLAIN HOW TO DRAW AN UPTREND LINE AND A DOWNTREND LINE
For you to draw your trend lines, you have to define your time frame. You have to draw trend lines that connect at least up to three major swing points.
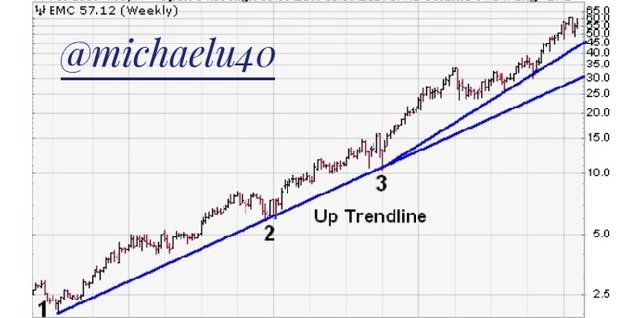
Uptrend line
To draw an uptrend line, you have to draw the line below the price. You must have at least three low points and the slope must be positive, which means that the second low must be higher than the first low.
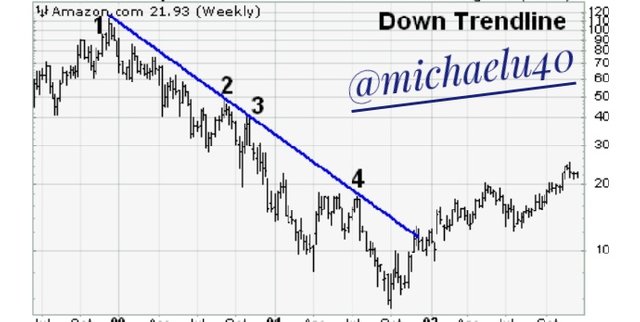
Downtrend Line
In a downtrend, the line is drawn above the price. You need up to three high points and the slope must be negative which means that the second high must be lower than the first.
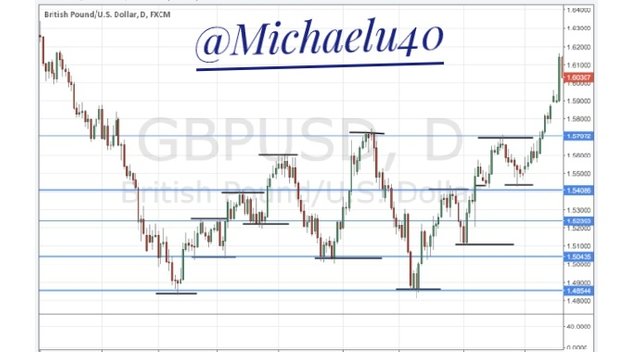
DEFINE IN YOUR OWN WORDS WHAT SUPPORTS AND RESISTANCES ARE AND HOW WE CAN IDENTIFY BOTH ZONES?
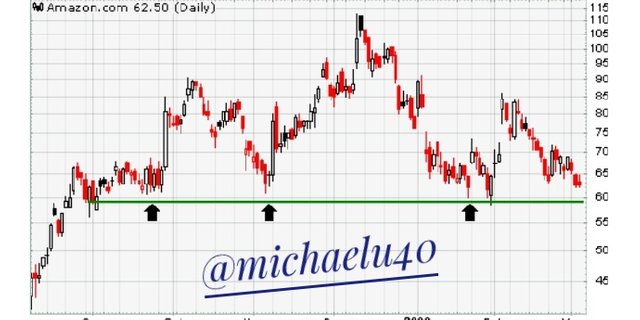
Support is the level where the price movement finds it difficult to decrease further until eventually it starts increasing during a downtrend. This indicate that many traders are making trading decision at that level.
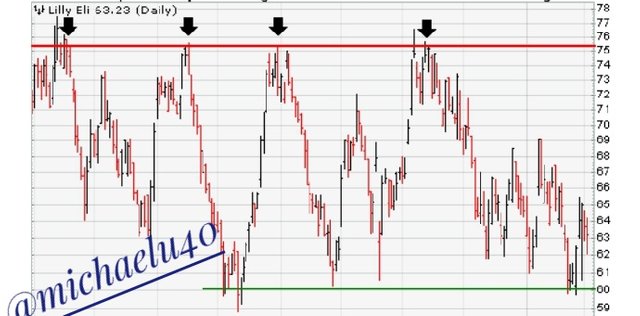
Resistance refers to the level where the price movement finds it difficult to increase further until eventually it starts descending during an uptrend.
Support and Resistance assist traders to know when prices are going to start increasing or decreasing and therefore help to make more profits and reduce much losses. It is a tool used in forecasting the direction of movement of price of an asset in a chart.
To identify both zones, once you pick a candlestick chart, first identify all swing highs and lows in the chart.
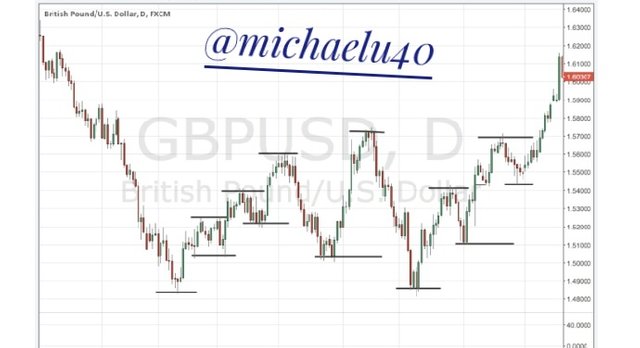
Then you add lines to connect the highs or lows linking them together. The connected lines will now form the support and Resistance zones.
EXPLAIN IN YOUR OWN WORDS AT LEAST 2 SIMPLE CHART PATTERNS ?
Head and Shoulders Pattern
This particular chart pattern helps traders to forecast a bullish or bearish reversal. In the chart, there is a large peak and then on either side of the large peak is a slightly smaller peak. You will notice that the first and third peak are smaller than the second peak. However, at the end of the period, all of them will fall back touching the same level of support.
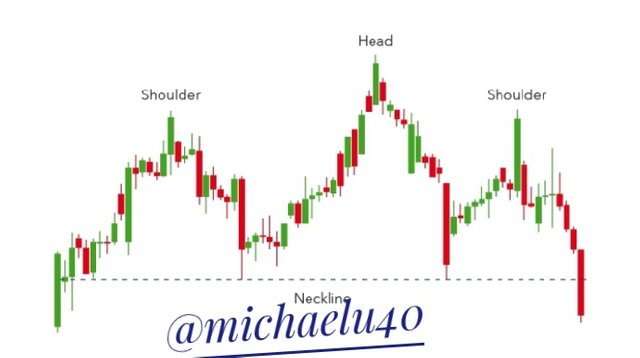
The second peak is referred to as the Head, while the first and third peak is labelled shoulder respectively. And by the time the third peak falls to the support level, it is possible that it will break out into a bearish downtrend.
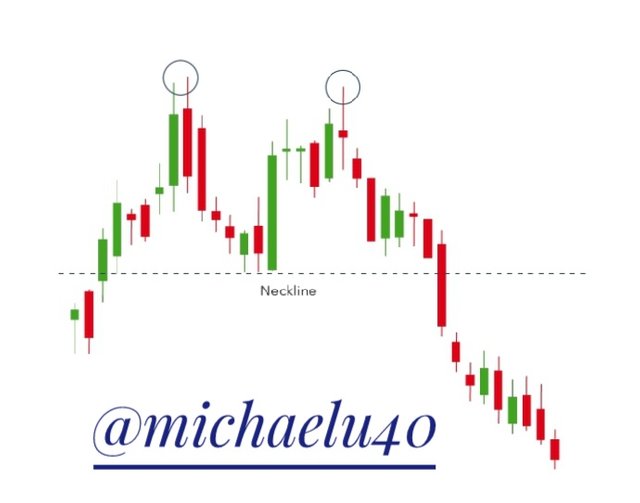
Double Top
This particular pattern is used to ascertain trend reversals. Normally, the price of the asset will move up, get to a peak, then fall back to the support level, then the price moves up one more time, falls back again but this time, more permanently against the existing trend.
I am grateful to Professor @lenonmc21