REPOST- TECHNICAL ANALYSIS - CRYPTO ACADEMY/ S4W2- HOMEWORK POST FOR @reminiscence01
Hi everyone, nice to be part of week 2 of season 4. This week's lecture on Technical analysis by prof @reminiscence01 is very informative and has broaden my knowledge about the use of Technical analysis and its indicators. Below is my homework task.

A). IN YOUR OWN WORDS, EXPLAIN TECHNICAL INDICATORS AND WHY IT IS A GOOD TECHNICAL ANALYSIS TOOL.
Technical Indicators also known as technical, are technical analysis tools used for analyzing or determining the price movement (trends) of assets in the market over a short period of time, which are represented in graphical form. These technical indicators makes use of past market prices and trends to have more understanding and ability in predicting the future market price movement.
The use of Technical indicators by technical analysts is based on the use of past trading data, such as the volume, price trend, momentum reading, open interest of an asset. Traders mostly use technical indicators to study price movement direction in a short-term, although technical indicators can be used to determine the beginning and end point of an asset price in a long-term.
I can say, technical indicators are like the foundation of technical analysis, and when combined with other technical analysis tool it gives a trader a great insight of price movementin the market. These Indicators play a vital role in the market and helps traders make best decisions when trading, some usefulness of technical indicators Include;
• Technical indicators alerts traders on the current market situation, it gives signals to traders to know when to trade(buy or sell) to make more profit.
• One important use of Technical indicator, is that it helps investors predict the price direction of assets in future market.
• Technical indicators are best used as a confirmation tool when comparedwith other technical analysis tools.
B). ARE TECHNICAL INDICATORS GOOD FOR CRYPTOCURRENCY ANALYSIS? EXPLAIN.
For me, I think technical indicators are good for cryptocurrency analysis. This is because, technical indicators involves mathematical calculations of past price trends and reading of momentum of an asset, which gives crypto traders signals and lead on when and how to trade. Considering the fact that cryptocurrency is highly volatile, the studying of past price data of a cryptocurrency will help predict what the future price will be. Technical indicators can show a crypto investor the potential risk, market reversals of price and also give the current price trend in the market, to help gain more profit.
As earlier stated, these indicators give early signal to traders/investors by looking at the indicators trends(that is the uptrend and downtrend movement), this helps in regulating Stop-loss and hence increases the Take-Profit ratio of a trade. Technical indicators also show crypto investors the support and resistance areas of a coin in the market. Nevertheless, technical indicators are best used as confirmatory tools, and gives best results when combined with other technical analysis tool.
C). ILLUSTRATE HOW TO ADD INDICATORS ON THE CHART AND ALSO HOW TO CONFIGURE THEM.(SCREENSHOT NEEDED)
I will use tradingview platform to illustrate how to add a technical indicator to a chart.
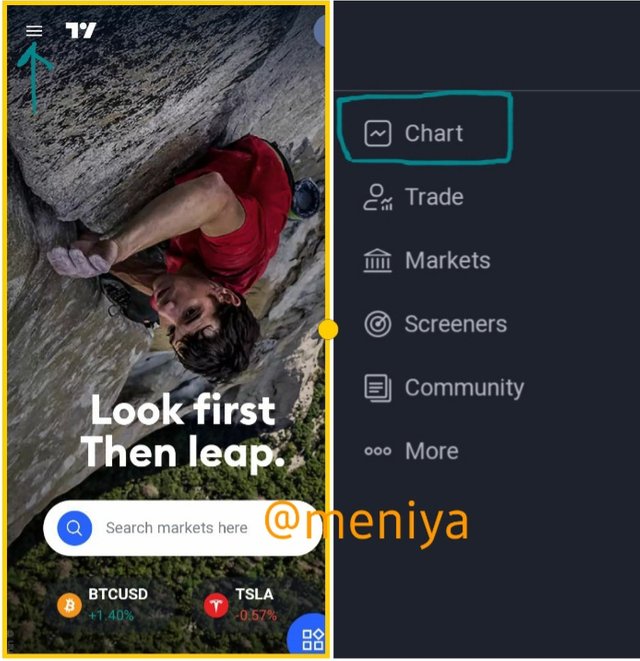
First, login to tradingview website.click on three dash icon at the top left, the fearures will show, click on charts and choose the cryptocurrency chart you want. I will use STEEM/BTC to show this.
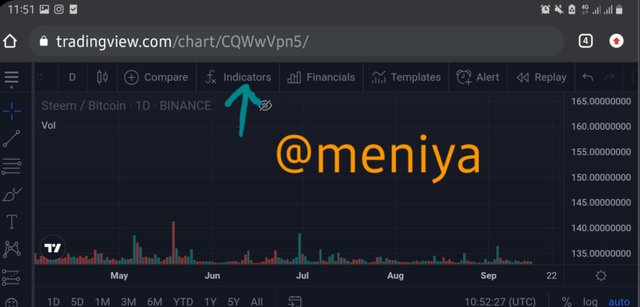
At the top of STEEM/BTC there are many features, click on the fx indicators
On the search buttom, write the indicator you want to add. I choose Relative Strength Index
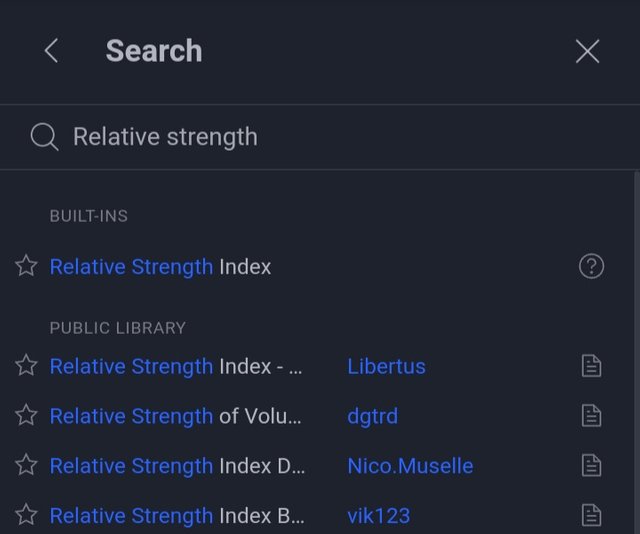
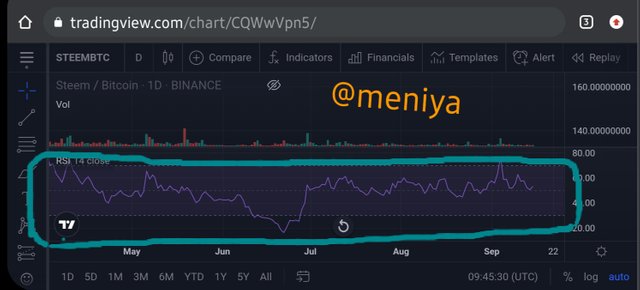
Go back to the chart you will see the indicator on display
TO CONFIGURE A TECHNICAL INDICATOR.
I will continue by configuring the vortex indicator I just added to the chart.
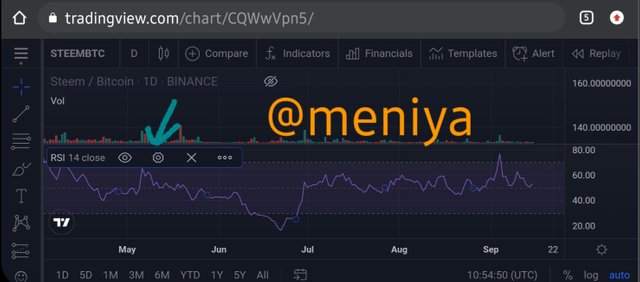
To configure the Relative Strength Index(RSI) , I click on the RSI indicator, some options comes up and I click on settings which is the gear icon
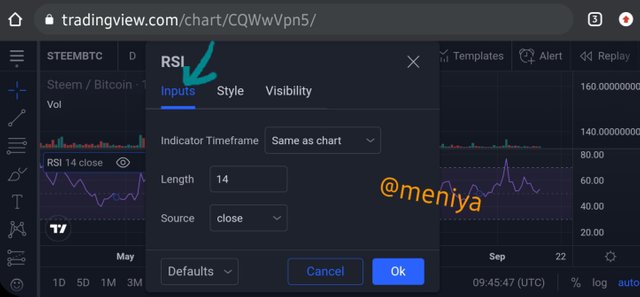
A configuring box will appear so you can now configure the charts. First, you click on Input, to enter your preferred length.
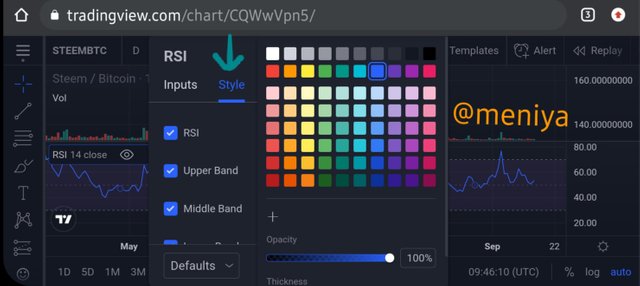
Next, click on Style to change the colour of RSI, I changed it to blue
Next, click on visibility to set to your preference.
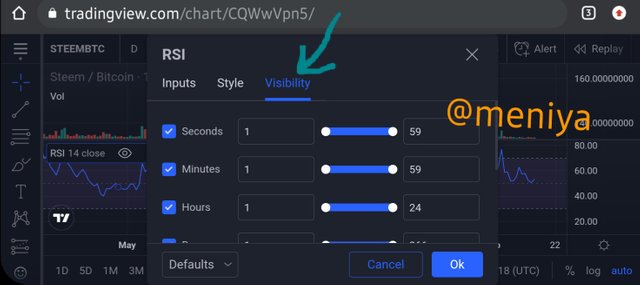
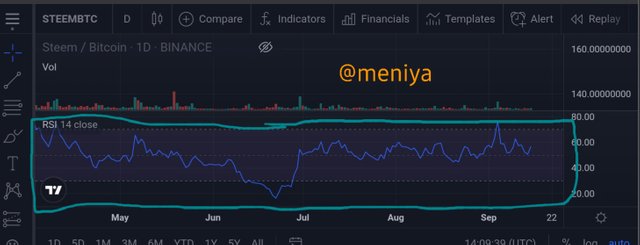
Below is a configured Relative Strength Index Indicator
Note: All screenshots are taken from Tradingview Source
A). EXPLAIN THE DIFFERENT CATERGORIES OF TECHNICAL INDICATORS AND GIVE AN EXAMPLE OF EACH CATEGORY.ALSO, SHOW THE INDICATOR USED AS AN EXAMPLE ON YOUR CHART.
There are basically three types of technical indicators. Below are a brief explanation of them.
•Trend Based Indicators
Trend indicators are designed to indicate the price trends direction in the market, which gives investors/traders better understanding of the trend. These trends indicator can be in a downtrend(weak) or uptrend(strong) direction, and are used as an important technical analysis tool when trading. Some examples of trend indicators are; Parabolic SAR, Average Directional Index (ADX), Ichimoku Kinko Hyo.
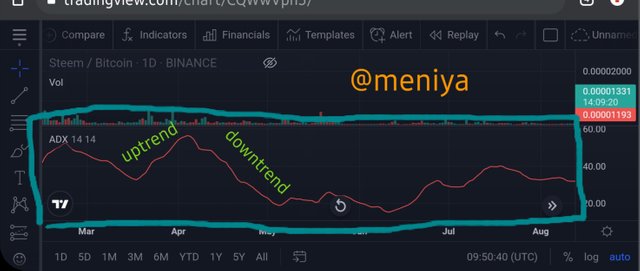
Average Directional Index(ADX) on the chart.
•Momentum-Based Indicators
Momentum based indicators also known as oscillators are indicators that shows the oscillation between the low and high price on a chart. When the price gets high the oscillator moves higher, thus indicating overbought of the asset. When price drops dowm the oscillators will move lower and this indicates oversold. So this indicator helps investors to know when to trade to make maximum profit. Some examples of momentum indicators are; **Stochastic, Relative Strength Index (RSI), Moving Average Convergence Divergence (MACD) etc.
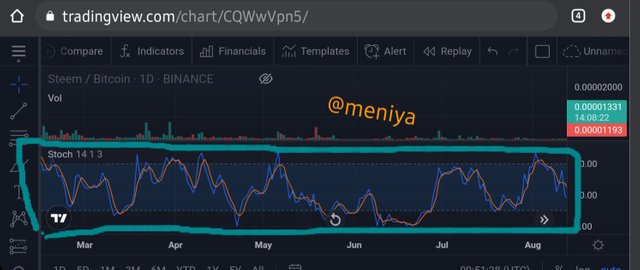
Stochastic indicator on the chart
•Volatility Based Indicators
This indicator comes in handy for traders considering the fact that cryptocurrency is highly volatile. Volatility indicators measures the range at which a price of commodity fluctuates(that is increases or decrease) within a period of time. This indicator helps traders decide on how to trading depending on the price at a particular time. When the price is low it signals a trader to buy and when the price is high it tells a trader to sell.
Some examples of these indicators are; ** Bollinger Bands, Average True Range (ATR).**
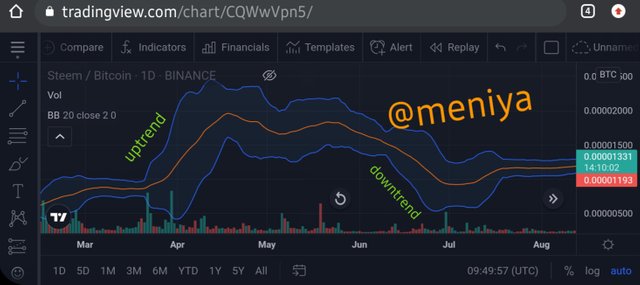
Bollinger Band indicator on the chart
All screenshots are taken from tradingview.com.
B). BRIEFLY EXPLAIN THE REASON WHY INDICATORS ARE NOT ADVISABLE TO BE USED AS A STANDALONE TOOL FOR TECHNICAL ANALYSIS
The use of single technical indicator is not advisable because it punch the hopes of a trader. No single indicator can work effectively and accurately, as a standalone tool may give a false-positive signal which may mislead a trader in predicting the future price of a commodity in the market. So it is advisable a trader uses a variety of indicators to get confirmation of the prediction made from mathematical calculations. It is advisable to use about 2-3 indicators, if all shows same signal and prediction direction, then a trader can make the best decision for trading at that particular point in time. For instance, a trend based indicator and momentum based indicators can be used together to get a better results.
C). EXPLAIN HOW AN INVESTOR CAN INCREASE THE SUCCESS RATE OF A TECHNICAL INDICATOR SIGNAL.
In order for an investor to increase the success rate of a technical indicator signal, the investor must first know and understand how well the indicator works, how to configure it, and the best indicator to be used within that timeframe to make the right decision to increase success rate. With Knowing these few things, it is also advisable investors use a variety of indicators in order to get accurate signals to aid in trading.
Thanks prof @reminiscence01, for an insightful lecture. Warm regards.
This is a repost. @reminiscence01.
Hello again, @reminiscence01, @steemcurator02, @steemitblog.
For 3days till 2hours ago, have been sending memos concerning my task last week that have not been curated, and im less than 1hour the post would expire and yet nothing has been done. I had to republish it again. Please i beg of you all kindly attend to be. Thank you very much an warm regards.
Old link: https://steemit.com/hive-108451/@meniya/technical-analysis-crypto-academy-s4w2-homework-post-for-reminiscence01
New link: https://steemit.com/hive-108451/@meniya/4sydmv-technical-analysis-crypto-academy-s4w2-homework-post-for-reminiscence01
Proof of delay
Cc:@sapwood
We are extremely sorry for the inconvenience caused to you.
We would request you repost this Task with the screenshot of the remarks/grading, and also mention in the title that it is a REPOST. And tag your professor.
Thank you.
Thank you prof for your swift response, have reposted as you said. I'm grateful